

Official NCERT Solutions for Class 11 Geography: Chapter 08 Weather Instruments Maps and Charts
Access comprehensive textbook solutions for Chapter 08 Weather Instruments Maps and Charts using the official curriculum guides for Class 11 Geography. Designed to align with the 2026-27 NCERT standards, these detailed answers help students reinforce core academic concepts.
Chapter-wise Solutions for Geography: Chapter 08 Weather Instruments Maps and Charts
Access the complete solution PDF for Class 11 Geography below. Regular practice with these targeted textbook answers builds familiarity with standard question patterns and helps secure higher marks in final school evaluations.
NCERT Solutions for Class 11 Geography for Chapter 8 Weather Instruments Maps and Charts
1. Choose the right answer from the four alternatives given below
(i) Which department prepares the weather map of India for each day?
(a) The World Meteorological Organisation
(b) The Indian Meteorological Department
(c) The Survey of India
(d) None of these
Answer: (b) The Indian Meteorological Department
(ii) Which two liquids are used in maximum and minimum thermometers?
(a) Mercury and water
(b) Water and alcohol
(c) Mercury and alcohol
(d) None of these
Answer: (c) Mercury and alcohol
(iii) Lines connecting the places of equal pressure are called
(a) Isobars
(b) Isohyets
(c) Isotherms
(d) Isohels
Answer: (a) Isobars
(iv) The primary tool for weather forecasting is
(a) Thermometer
(b) Barometer
(c) Maps
(d) Weather charts
Answer: (d) Weather charts
(v) If there is more humidity in the air, the difference between the readings of a dry bulb and a wet bulb will be
(a) Less
(b) More
(c) Equal
(d) None of these
Answer: (a) Less
2. Answer the following questions in about 30 words
i. What are the basic elements of weather?
Answer: The basic elements of weather are rainfall, temperature, sunshine and cloudiness, direction and velocity of winds, etc.
ii. What is a weather chart?
Answer: Weather chart is a map showing the principal meteorological elements at a given time and over an extended region. The data received from various weather observatories are in plenty and detailed and it cannot be incorporated in one single chart. Weather charts provide the primary tools for weather forecasting.
iii. Which instruments are normally available in Class-I observatory to measure the weather phenomena?
Answer: The highest category is Class-I. The following instruments are normally available in Class-I observatory to measure the weather phenomena.
Maximum and minimum thermometers
Anemometer and wind vane
Dry and Wet bulb thermometer
Rain gauge
Barometer
iv. What are Isotherms?
Answer: Lines on map connecting places of equal temperature are called Isotherms.
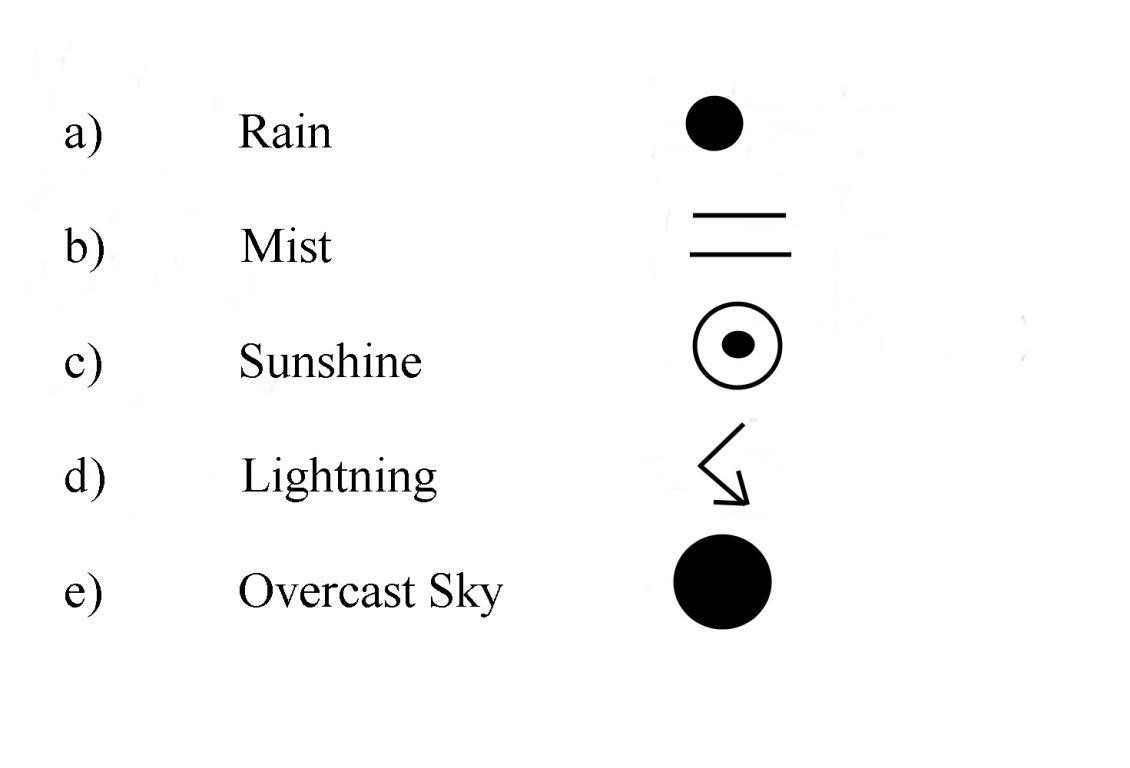
v. Which meteorological symbols are used to mark the following on a weather map?
a) Rain b) Mist
c) Sunshine
d) Lightning
e) Overcast Sky
Answer:
3. Answer the following question in not more than 125 words.
Discuss how weather maps and charts are prepared and how they are useful to us.
Answer: Observations about the temperature, rainfall, sunshine and cloudiness, direction and velocity of winds, etc., being taken at fixed hours are transmitted by code to the forecasting stations by the meteorological observatories. Data is also collected on ships plying on the Indian seas, weather observatories in Antarctica, the International Indian Ocean Expedition, and the launching of rockets and weather satellites. The central office keeps a record of the observations, which forms the basis for making a weather map. The atmospheric observations which are procured from hill stations, aeroplanes, pilot balloons, etc., are plotted separately. Meteorological observatories transmit the data to the Central Observatory at Pune twice a day.
The data received from various weather observatories cannot be incorporated in one single chart. Therefore, the meteorological symbols are used. Weather charts provide the primary tools for weather forecasting. They help in locating and identifying different air masses, pressure systems, fronts and areas of precipitation.
Weather forecasts help in taking safety measures in advance in case of the likelihood of bad weather, i.e., cyclone and thunderstorm, etc. Predicting weather a few days in advance may prove very useful to farmers and ship’s crew, industrialist, traders, pilots, fishermen, defence forces, etc.
MAP READING
Study the Figures 8.12 and 8.13 and answer the following questions. (see map in NCERT Book)
(a) Which seasons are shown in these maps?
Answer: Map 8.12 shows the rainy season, as it starts with the onset of the southwest monsoon in June and continues till the middle of September. Map 8.13 shows the winter season and January and February are the coldest months in India.
(b) What is the value of the highest isobar in Figure 8.12 and through which part of the country does it pass?
Answer: 1010 mb, it passes through the Lakshadweep islands and south-west of Kerala.
(c) What are the values of the highest and the lowest isobars in Figure 8.13 and where are they located?
Answer: The highest pressure isobar of 1020 mb passes through Jammu and Kashmir. The lowest pressure isobar of 1013 mb passes through Kerala, Lakshadweep islands, and Andaman and Nicobar Islands.
(d) What are the patterns of temperature distribution in both the maps?
Answer: In July, most of the western India, coastal areas of Andhra Pradesh and Tamil Nadu experience high temperature abound 30 °C, but the hilly and mountainous areas of India receive less temperature. In the month of January, mean temperature is around 20°C to 25°C in south India, but it is between 10°C to 20°C in northern India.
(e) In which parts do you see the highest and the lowest mean temperature in Figure 8.12?
Answer: Western part of India receives highest mean temperature, i.e., 30°C. The northern Himalayas and Nilgiri hills receive lowest mean temperature i.e., 20°C.
(f) What relationship do you see between the distribution of temperature and pressure in both the maps?
Answer: The relationship between the distribution of temperature and pressure is that where temperature is high, the air pressure is low and where the temperature is low, the air pressure is high.
Geography Class 11 Curriculum Solutions: Chapter 08 Weather Instruments Maps and Charts
Chapter Exercise Answers for Class 11 Geography
Review comprehensive exercise answers for Class 11 Geography Chapter 08 Weather Instruments Maps and Charts. Fully updated to match current NCERT syllabus guidelines, these textbook solutions help students verify their work and maintain accurate study notes.
Detailed Answer Guides for Chapter 08 Weather Instruments Maps and Charts
Beyond providing final answers, these guides offer step-by-step breakdowns for complex queries in the Class 11 Geography module. This approach helps students balance theoretical depth with practical problem-solving skills required for NCERT exams.
Complete Preparation Kit for Class 11 Exams
These resources act as an effective roadmap for daily homework tasks and independent study. Supplement your review of Chapter 08 Weather Instruments Maps and Charts with official sample papers and interactive practice tests available on our platform free of charge.
FAQs
The complete and updated NCERT Solutions Class 11 Geography Chapter 8 Weather Instruments Maps and Charts is available for free on StudiesToday.com. These solutions for Class 11 Geography are as per latest NCERT curriculum.
Yes, our experts have revised the NCERT Solutions Class 11 Geography Chapter 8 Weather Instruments Maps and Charts as per 2026 exam pattern. All textbook exercises have been solved and have added explanation about how the Geography concepts are applied in case-study and assertion-reasoning questions.
Toppers recommend using NCERT language because NCERT marking schemes are strictly based on textbook definitions. Our NCERT Solutions Class 11 Geography Chapter 8 Weather Instruments Maps and Charts will help students to get full marks in the theory paper.
Yes, we provide bilingual support for Class 11 Geography. You can access NCERT Solutions Class 11 Geography Chapter 8 Weather Instruments Maps and Charts in both English and Hindi medium.
Yes, you can download the entire NCERT Solutions Class 11 Geography Chapter 8 Weather Instruments Maps and Charts in printable PDF format for offline study on any device.