
Read and download the CBSE Class 11 Economics Measures Of Dispersion Worksheet in PDF format. We have provided exhaustive and printable Class 11 Economics worksheets for Statistics for Economics Chapter 6 Measures of Dispersion, designed by expert teachers. These resources align with the 2026-27 syllabus and examination patterns issued by NCERT, CBSE, and KVS, helping students master all important chapter topics.
Chapter-wise Worksheet for Class 11 Economics Statistics for Economics Chapter 6 Measures of Dispersion
Students of Class 11 should use this Economics practice paper to check their understanding of Statistics for Economics Chapter 6 Measures of Dispersion as it includes essential problems and detailed solutions. Regular self-testing with these will help you achieve higher marks in your school tests and final examinations.
Class 11 Economics Statistics for Economics Chapter 6 Measures of Dispersion Worksheet with Answers
CBSE Class 11 Economics Worksheet - Measures Of Dispersion - Practice worksheets for CBSE students. Prepared by teachers of the best CBSE schools in India.
CLASS –XI
Economics
Measures of dispersion
Question: Coefficient of variation is given by
(a) σ/ ¯X
(b) ¯X/σ
(c) ¯X/σ x100
(d) σ/¯X x100
Answer: D
Question: The standard deviation of a data set is expressed in the
(a) same unit as the observations in the data set
(b) square of the unit of the observation
(c) square root of the unit of the observation
(d) None of the above
Answer: A
Question: Which of the following is a unit free number?
(a) SD
(b) Variance
(c) MD
(d) CV
Answer: D
Question: Standard deviation is always computed from
(a) mean
(b)mode
(c) median
(d) geometric mean
Answer: A
Question: Standard deviation is ……… measure of dispersion.
(a) absolute
(b) relative
(c) crude
(d) Both (a) and (b)
Answer: A
Question: Greater the value of standard deviation, ……… is the consistency of data.
(a) lesser
(b) greater
(c) constant
(d)None of these
Answer: B
Question: Which of the following mathematical sign is used to denote standard deviation?
(a) W
(b) s
(c) s2
(d) S
Answer: C
Question: Statement I Variance is the square of standard deviation for any type of statistical series.
Statement II As the sample size increases, variance becomes equal to standard deviation.
Alternatives
(a) Statement I is correct and Statement II is incorrect
(b) Statement II is correct and Statement I is incorrect
(c) Both the statements are correct
(d) Both the statements are incorrect
Answer: A
Question: Standard deviation is ……… of the arithmetic average of the squares of the deviations measured from the mean.
(a) square root
(b) cube root
(c) sum total
(d)None of these
Answer: A
Question: Statement I Coefficient of variation is used to check the consistency of the data.
Statement II Standard deviation can never becalculated without arithmetic mean.
Alternatives
(a) Statement I is correct and Statement II is incorrect
(b) Statement II is correct and Statement I is incorrect
(c) Both the statements are correct
(d) Both the statements are incorrect
Answer: A
Question: Which of the following is not true about the measures of dispersion?
(a) It serve to locate the distribution
(b) Indicates high or low uniformity of the items
(c) Reveals how items are spread out on either side of the centre
(d) Difference or variation among the values
Answer: A
Question: The calculated value of standard deviation can never be .......... .
(a) less than one
(b) more than one
(c) negative
(d) more than variance
Answer: C
Question: Which of the following statement is true about the most important disadvantage of standard deviation?
(a) It is used in many other statistical techniques
(b) It doesn’t takes into account all the values in the data set
(c) It is a sensitive measure of dispersion
(d) It is difficult to calculate manually
Answer: D
Question: When the actual mean is multiplied with the coefficient of variation, it becomes equal to .......... .
(a) variance
(b) coefficient of standard deviation
(c) standard deviation
(d) coefficient of arithmetic mean
Answer:C
Question: The minimum value or the lower limit of variance can be ......... .
(a) −1
(b) 0
(c) 1
(d)None of these
Answer: B
Question: Choose the incorrect statement from the options given below.
(a) Standard deviation is not based upon all the items of the series
(b) Standard deviation is the square root of variance
(c) Coefficient of standard deviation is a relative measure of dispersion
(d) All of the above
Answer: A
Question: For calculation standard deviation by step deviation method which of the following mean is used?
(a) Actual mean
(b) Assumed mean
(c) Combined mean
(d) Any of these
Answer: B
Question: Given below are the relative measures of dispersion except
(a) coefficient of variation
(b) coefficient of standard deviation
(c) standard deviation
(d) Both (a) and (b)
Answer: C
Question: Standard deviation remains unchanged due to change in which of the following?
(a) Change of Origin
(b) Change of Scale
(c) Change of Data
(d) All of these
Answer: A
Assertion-Reasoning Based MCQs :
(a) Both Assertion (A) and Reason (R) are true and Reason (R) is the correct explanation of Assertion (A)
(b) Both Assertion (A) and Reason (R) are true, but Reason (R) is not the correct explanation of Assertion (A)
(c) Assertion (A) is false, but Reason (R) is true
(d) Both are false
Question: Assertion (A) If the Variance of a series is 36, its standard deviation will be 6.
Reason (R) Variance is the square of standard deviation.
Answer: A
Question: Assertion (A) Any measure of central tendency can be used to compute standard deviation.
Reason (R) Standard deviation gives best result when calculated from median.
Answer: D
Question: Assertion (A) When two statistical series are compared, a series with lower coefficient of variation is considered as consistent.
Reason (R) Lower value of coefficient of variation indicates lower fluctuation in the given distribution.
Answer: A
Question: Assertion (A) Standard deviation cannot be calculated in a mid-value frequency distribution.
Reason (R) Mid-value frequency distribution need to be converted into exclusive frequency distribution to calculate standard deviation.
Answer: D
Case Study Questions Measures of Dispersion Class 11 Economics :
You’re given the following information about the average salaries of people working in different fields.
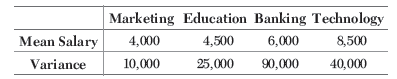
Question: Based upon the above data, what will be the standard deviation of the banking sector?
(a) 90,000
(b) 9,000
(c) 300
(d) 30
Answer: C
Question: The coefficient of standard deviation of the education sector will be equal to ......... .
(a) 0.03
(b) 0.3
(c) 3.33
(d) Can’t be determined
Answer: A
Question: Which of the following sectors pays highest salary on an average?
(a) Marketing
(b) Education
(c) Banking
(d) Technology
Answer: D
Question: Which of the following sectors from the above data is most consistent?
(a) Marketing
(b) Education
(c) Banking
(d) Technology
Answer: D
Question: Assertion (A) Marketing sector shows the least value of coefficient of variation in the given data.
Reason (R) Lower value of coefficient of variation makes it least consistent among all the given sectors.
Alternatives
(a) Both Assertion (A) and Reason (R) are true and Reason (R) is the correct explanation of Assertion (A)
(b) Both Assertion (A) and Reason (R) are true, but Reason (R) is not the correct explanation of Assertion (A)
(c) Assertion (A) is false, but Reason (R) is true
(d) Both are false
Answer: D
Question: Statement I Coefficient of variation of marketing sector as per the above data is 2.5.
Statement II Coefficient of variation presents information in percentage form.
Alternatives
(a) Statement I is correct and Statement II is incorrect
(b) Statement II is correct and Statement I is incorrect
(c) Both the statements are correct
(d) Both the statements are incorrect
Answer: D
Short Answer Type Questions :
Question: What features should a good measure of dispersion possess?
Answer: Features/Properties of a good measure of dispersion are
(i) It should be rigidly defined.
(ii) It should be simple to understand.
(iii) It should be easy to calculate.
(iv) It should be based on all the observations of the series.
(v) It should be least affected by sampling fluctuations.
(vi) It should be capable of further algebraic treatment.
(vii) It should not be affected by extreme values.
Question: Briefly explain the concept of standard deviation using its formula to calculate the same.
Answer: The positive square root of the sum of square of deviations of various values from their mean divided by the sample size is called standard deviation. The idea of standard deviation was first given by Karl Pearson in 1893.
Symbolically, σ = √∑d2/n
It fulfils all the requisites of a good measure of dispersion except that it is sensitive to extreme values.
Question: State some important merits of standard deviation.
Answer: Some important merits of standard deviation
(i) It is based on all values of the series.
(ii) It is an exact and definite measure of dispersion.
(iii) It is least affected by fluctuations in sampling because samples are based on all values of the series.
(iv) It is suitable for further algebraic treatment.
Question: Mention the objectives of various measures of dispersion.
Answer: Objectives of measures of dispersion are
(i) Measures of dispersion help in statistical investigation.
(ii) They help to determine the reliability of an average.
(iii) They help to compare the variability of two or more series.
(iv) They serve as the basis of computation of other statistical measures such as correlation, etc.
(v) They help to control the variation of the data from the central value.
Question: State some important demerits of standard deviation.
Answer: Some important demerits of standard deviation are
(i) It is difficult to calculate as compared to other measures of dispersion.
(ii) It is unduly affected by extreme values of the series as it is based on all the items.
(iii) It cannot be used to compare two series expressed in different units.
Question: Write the correct formula of calculating following measures of dispersion
(i) Coefficient of Standard Deviation
(ii) Coefficient of Variation
(iii) Variance
Answer: Formula for computing
(i) Coefficient of Standard Deviation = σ/ -X
(ii) Coefficient of Variation = σ -×X 100
(iii) Variance = σ2, where
σ= Standard Deviation, and
- X = Arithmetic Mean
Question: What are the properties of standard deviation?
Answer: The properties of standard deviation are as follows (i) Standard deviation is the most popular measure of dispersion.
(ii) It is not affected by change in origin, but is affected by change in scale.
(iii) A distribution with lesser coefficient of variation shows greater consistency, homogeneity and uniformity,whereas a distribution with greater coefficient of
variation is considered more scattered.
(iv) For two or more groups, it is possible to measure the combined standard deviation
Question: The sum of square of deviations for 10 observations taken from mean 50 is 25. Find the coefficient of variation.
Answer: Given,
Number of observations (n) = 10
Mean (X-) = 50
Sum of square of deviations (∑d2 ) = 25
We know that σ = √∑d2/n
On substituting the variables, we get
σ=√25/10=1.58
Coefficient of Variation = σ/ -x100
=1.58/50x100=3.16
Question: Explain the term ‘dispersion’ what is the other name for it?
Question: Enumerate the objectives of measuring dispersion.
Question: Give the meaning & formula for the following .
(a) Range
(b) Inter-quartile Range
(c) Mean Deviation
(d) Standard Deviation
Question: Give the names of relative measures & their formulae
Question: Give 2 merits and demerits of each measure of dispersion .
Question: What are the uses of Range.
Question: Write a note on other measures from standard deviation.
Question:Differentiate between Absolute & relative measures of dispersions.
Question: Explain the graphical method of measuring dispersion.
Question: Find out Range and its coefficient for the following data
320,400,450,530,550,580,600,610,700.780,800
Free study material for Economics
CBSE Economics Class 11 Statistics for Economics Chapter 6 Measures of Dispersion Worksheet
Students can use the practice questions and answers provided above for Statistics for Economics Chapter 6 Measures of Dispersion to prepare for their upcoming school tests. This resource is designed by expert teachers as per the latest 2026 syllabus released by CBSE for Class 11. We suggest that Class 11 students solve these questions daily for a strong foundation in Economics.
Statistics for Economics Chapter 6 Measures of Dispersion Solutions & NCERT Alignment
Our expert teachers have referred to the latest NCERT book for Class 11 Economics to create these exercises. After solving the questions you should compare your answers with our detailed solutions as they have been designed by expert teachers. You will understand the correct way to write answers for the CBSE exams. You can also see above MCQ questions for Economics to cover every important topic in the chapter.
Class 11 Exam Preparation Strategy
Regular practice of this Class 11 Economics study material helps you to be familiar with the most regularly asked exam topics. If you find any topic in Statistics for Economics Chapter 6 Measures of Dispersion difficult then you can refer to our NCERT solutions for Class 11 Economics. All revision sheets and printable assignments on studiestoday.com are free and updated to help students get better scores in their school examinations.
FAQs
You can download the latest chapter-wise printable worksheets for Class 11 Economics Statistics for Economics Chapter 6 Measures of Dispersion for free from StudiesToday.com. These have been made as per the latest CBSE curriculum for this academic year.
Yes, Class 11 Economics worksheets for Statistics for Economics Chapter 6 Measures of Dispersion focus on activity-based learning and also competency-style questions. This helps students to apply theoretical knowledge to practical scenarios.
Yes, we have provided solved worksheets for Class 11 Economics Statistics for Economics Chapter 6 Measures of Dispersion to help students verify their answers instantly.
Yes, our Class 11 Economics test sheets are mobile-friendly PDFs and can be printed by teachers for classroom.
For Statistics for Economics Chapter 6 Measures of Dispersion, regular practice with our worksheets will improve question-handling speed and help students understand all technical terms and diagrams.