

Download the latest CBSE Class 7 Mathematics Data Handling Notes in PDF format. These Class 7 Mathematics revision notes are carefully designed by expert teachers to align with the 2026-27 syllabus. These notes are great daily learning and last minute exam preparation and they simplify complex topics and highlight important definitions for Class 7 students.
Revision Notes for Class 7 Mathematics Chapter 3 Data Handling
To secure a higher rank, students should use these Class 7 Mathematics Chapter 3 Data Handling notes for quick learning of important concepts. These exam-oriented summaries focus on difficult topics and high-weightage sections helpful in school tests and final examinations.
Chapter 3 Data Handling Revision Notes for Class 7 Mathematics
CBSE Class 6 English Practice Passages. Learning the important concepts is very important for every student to get better marks in examinations. The concepts should be clear which will help in faster learning. The attached concepts made as per NCERT and CBSE pattern will help the student to understand the chapter and score better marks in the examinations.
Data Handling
Data Representation
Any information collected can be first arranged in a frequency distribution table, and this information can be put as a visual representation in the form of pictographs or bar graphs. Graphs are a visual representation of organised data.
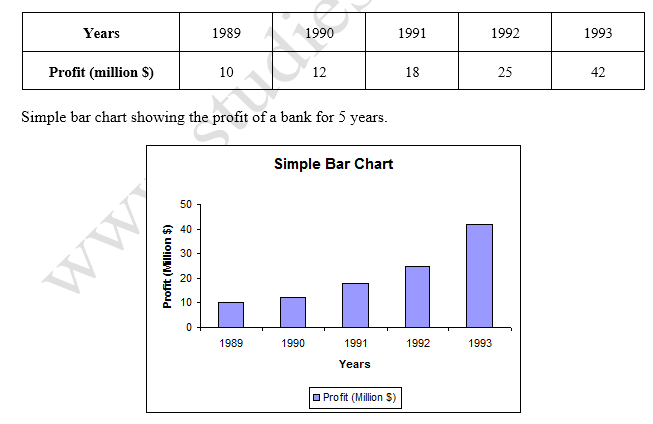
A bar graph is the representation of data using rectangular bars of uniform width, and with their lengths depending on the frequency and the scale chosen. The bars can be plotted vertically or horizontally. You can look at a bar graph and make deductions about the data.
Bar graphs are used for plotting discrete or discontinuous data, i.e. data that has discrete values and is not continuous. Some examples of discontinuous data are 'shoe size' and 'eye colour', for which you can use a bar chart. On the other hand, examples of continuous data include 'height' and 'weight'. A bar graph is very useful if you are trying to record certain information, whether the data is continuous or not.
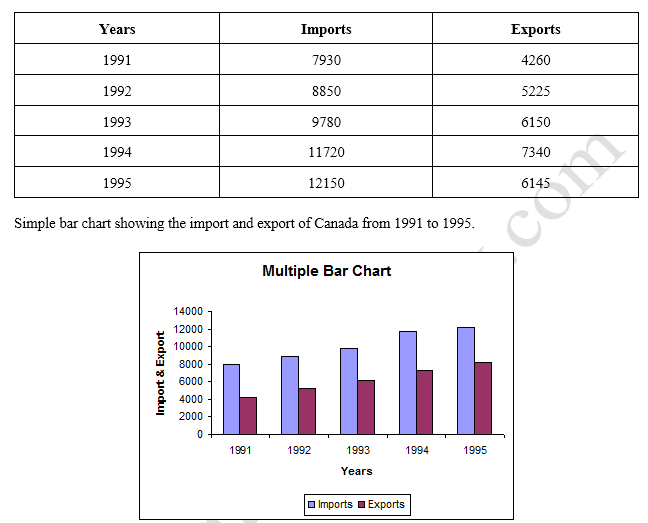
Graphs can also be used for comparative analysis. Double bar graphs are used for comparing data between two different things. The difference between a bar graph and a double bar graph is that a bar graph displays one set of data, and a double bar graph compares two different sets of information or data.
Example 1: Draw simple bar diagram to represent the profits of a bank for 5 years.
Example 2: Draw multiple bar chart to represent the import and export of Canada (values in $) for the years 1991 to 1995.
Measure of Central tendency
1.Arithmetic mean: Arithmetic mean is a number that lies between the highest and the lowest value of data.

Note: Arranging the data in ascending or descending order is not needed to calculate arithmetic mean.
2.Range: Range = Highest observation – Lowest observation
3.Mode: Mode refers to the observation that occurs most often in a given data. The following are the steps to calculate mode:
Step – 1: Arrange the data in ascending order
Step – 2: Tabulate the data in a frequency distribution table.
Step – 3: The most frequently occurring observation will be the mode.
Note:
• It is possible for a set of data values to have more than one mode.
• If there are two data values that occur most frequently, we say that the set of data values is bimodal.
• If there is no data value or data values that occur most frequently, we say that the set of data values has no mode.
4. Median: Median refers to the value that lies in the middle of the data with half of the observations above it and the other half of the observations below The following are the steps to calculate median
Step – 1: Arrange the data in ascending order.
Step – 2: Find the middle terms.
If there is only one middle term, then that term is the median. If there are two middle terms, then the average of both the terms gives the median.
The mean, mode and median are representative values of a group of observations or data, and lie between the minimum and maximum values of the data. They are also called measures of the central tendency.
Example: Calculate the arithmetic mean, range, median and mode of the following data:
2, 4, 7, 4, 9, 5, 7, 3, 6, 7
Solution:
Arithmetic mean = sum of all observations / number of observations = 2 + 4 + 7 + 4 + 9 + 5 + 7 + 3 + 6 + 7 / 10
Median: 54/10 = 5 . 4
Step –I : Arranging the datas in ascending order,
2,3,4,4,5,6,7,7,7,9
Step –II Here the middle terms are 5 and 6
The average of 5 and 6 = 5 + 6 / 2 = 11/2 = 5.5
Therefore, Median = 5.5
Mode: The most repeating values is 7. Therefore, Mode is 7.
Range: Range = Highest observation – Lowest observation = 9 – 2 =7
Mode of Large Data
Example: Following are the margins of victory in the football matches of a league.
1, 3, 2, 5, 1, 4, 6, 2, 5, 2, 2, 2, 4, 1, 2, 3, 1, 1, 2, 3, 2,6, 4, 3, 2, 1, 1, 4, 2, 1, 5, 3, 3, 2, 3, 2, 4, 2, 1, 2
Find the mode of this data.
Solution: Let us put the data in a tabular form:
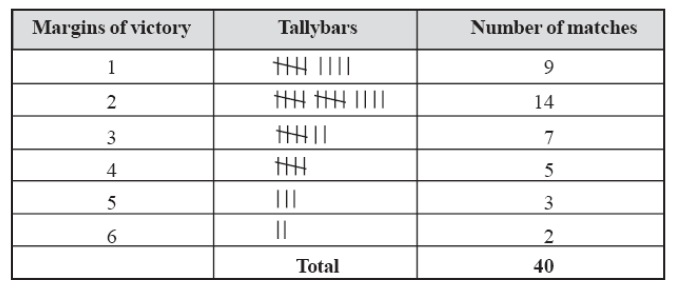
Since 2 has occurred the highest number of times 2 is the mode. Thus, most of the matches have been won with a victory margin of 2 goals.
Probability
In our daily life we come across the words like probably, likely, may be, chance and hope etc. All these are synonyms to probability.
Probability is defined as the numerical method of measuring uncertainty involved in a situation.
It is widely used in the study of mathematics, statistics, gambling, physical science, biological science, weather forecasting, finance etc. to draw conclusions. An experiment is defined as an action or process that results in well defined outcomes.
An experiment, in which we know all the results, but cannot predict them, is called a random experiment. The possible results of an experiment are called the outcomes A combination of outcomes is called an event. For example when an unbiased die is rolled getting an even number is an event. In this event the outcomes are {2,4,6}. When an experiment is performed, outcomes are said to be equally likely, if each outcome has the same chance of occurring. Probability of event E is defined as :
Probability of event = No. of favourable outcomes / Total number of outcomes
Examples: A bag has 4 red balls and 2 yellow balls. (The balls are identical in all respects other than colour). A ball is drawn from the bag without looking into the bag. What is probability of getting a red ball? Is it more or less than getting a yellow ball?
Solution: There are in all (4 + 2 =) 6 outcomes of the event.
Getting a red ball consists of 4 outcomes.
Probability of event = No . of favourable outcomes / Total number of outcomes
Therefore, i) the probability of getting a red ball = 4/6 = 3/2
ii) the probability of getting a yellow ball = 2/6 = 2/3
Therefore, the probability of getting a red ball is more than that of getting a yellow ball.
Please click the link below to download pdf file for CBSE Class 7 Data Handling Concepts.
Free study material for Mathematics
CBSE Class 7 Mathematics Chapter 3 Data Handling Notes
Students can use these Revision Notes for Chapter 3 Data Handling to quickly understand all the main concepts. This study material has been prepared as per the latest CBSE syllabus for Class 7. Our teachers always suggest that Class 7 students read these notes regularly as they are focused on the most important topics that usually appear in school tests and final exams.
NCERT Based Chapter 3 Data Handling Summary
Our expert team has used the official NCERT book for Class 7 Mathematics to design these notes. These are the notes that definitely you for your current academic year. After reading the chapter summary, you should also refer to our NCERT solutions for Class 7. Always compare your understanding with our teacher prepared answers as they will help you build a very strong base in Mathematics.
Chapter 3 Data Handling Complete Revision and Practice
To prepare very well for y our exams, students should also solve the MCQ questions and practice worksheets provided on this page. These extra solved questions will help you to check if you have understood all the concepts of Chapter 3 Data Handling. All study material on studiestoday.com is free and updated according to the latest Mathematics exam patterns. Using these revision notes daily will help you feel more confident and get better marks in your exams.
FAQs
You can download the teacher prepared revision notes for CBSE Class 7 Mathematics Data Handling Notes from StudiesToday.com. These notes are designed as per 2026-27 academic session to help Class 7 students get the best study material for Mathematics.
Yes, our CBSE Class 7 Mathematics Data Handling Notes include 50% competency-based questions with focus on core logic, keyword definitions, and the practical application of Mathematics principles which is important for getting more marks in 2026 CBSE exams.
Yes, our CBSE Class 7 Mathematics Data Handling Notes provide a detailed, topic wise breakdown of the chapter. Fundamental definitions, complex numerical formulas and all topics of CBSE syllabus in Class 7 is covered.
These notes for Mathematics are organized into bullet points and easy-to-read charts. By using CBSE Class 7 Mathematics Data Handling Notes, Class 7 students fast revise formulas, key definitions before the exams.
No, all study resources on StudiesToday, including CBSE Class 7 Mathematics Data Handling Notes, are available for immediate free download. Class 7 Mathematics study material is available in PDF and can be downloaded on mobile.