

Read and download the CBSE Class 9 Mathematics Statistics Assignment Set 01 for the 2026-27 academic session. We have provided comprehensive Class 9 Mathematics school assignments that have important solved questions and answers for Chapter 12 Statistics. These resources have been carefuly prepared by expert teachers as per the latest NCERT, CBSE, and KVS syllabus guidelines.
Solved Assignment for Class 9 Mathematics Chapter 12 Statistics
Practicing these Class 9 Mathematics problems daily is must to improve your conceptual understanding and score better marks in school examinations. These printable assignments are a perfect assessment tool for Chapter 12 Statistics, covering both basic and advanced level questions to help you get more marks in exams.
Chapter 12 Statistics Class 9 Solved Questions and Answers
1 Which of the following is t he number of times a part icular item occurs in a class interval?
(A) Mean
(B) Frequency
(C) Cumulative frequency
(D) Median
Answer : B
2 What are the groups into which large data is condensed called?
(A) Class limits
(C) Class size
(B) Classes
(D) Class width
Answer : B
3 Find t he mean of first 5 whole numbers.
(A) 2.5
(B) 3
(C) 1.5
(D) 2
Answer : D
4 The relative humidity (in o/o) of a city for 10 days is given in the box.
92 .1 97 .1 95 .7 93 .3 89
96.2 94.9 97.3 92.1 98.3
Determine its range.
(A) 9.3
(B) 9.6
(C) 9.5
(D) 9.8
Answer : A
5 The demand for different shirt sizes, as obt ained from a survey, is given in the table.
| Size | 38 | 39 | 40 | 41 | 42 | 43 | 44 |
| No. of persons | 26 | 36 | 20 | 15 | 13 | 7 | 5 |
Find the modal shirt size.
(A) 39
(B) 40
(C) 44
(D) 42
Answer : A
6 The class marks of a frequency distribution are given as 15, 20,25, ...........
Find the class corresponding to the class mark 20.
(A) 12.5 - 17.5
(B) 17.5 - 22.5
(C) 18.5 - 21.5
(D) 19.5 - 20.5
Answer : B
(7-10): The bar graph given shows the months of birthdays of 40 students of a class.
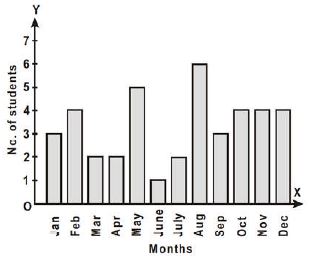
Answer the following questions based on the graph.
7 How many students were born in August?
(A) 6
(B) 4
(C) 5
(D) 3
Answer : A
8 In which mont h were the minimum number of students born?
(A) February
(B) June
(C) December
(D) May
Answer : B
9 In which mont hs were at least 5 students born?
(A) June and October
(B) March and November
(C) February and September
(D) May and August
Answer : D
10 In which months was the difference in the number of st udents born t he same as that in October and November?
(A) February and January
(B) May and July
(C) March and April
(D) August and September
Answer : C
11 Find the median of the first ten prime numbers.
(A) 24
(B) 14
(C) 12
(D) 22
Answer : C
12 In a school 90 boys and 30 girls appeared for a public examination.The mean marks of boys was found to be 45o/o whereas the mean marks of girls was 70%. What is the average marks o/o of the school?
(A) 61.50%
(B) 51.25%
(C) 40.50%
(D) 51.52%
Answer : B
13 What is a graph drawn with the midpoints of the t op sides of t he rectangles forming the histogram of a frequency distribution called?
(A) Bar graph
(B) Ogive
(C) Frequency polygon
(D) Frequency curve
Answer : C
14 What do yo u call t he value in a data around which the values of all the other observat ions t end to concentrate?
(A) Common value
(B) Range
(C) Measure of central t endency
(D) Midvalue
Answer : C
15 Of the class int ervals 10 - 20 and 20 - 30, the number 20 is included in which of the following?
(A) 10-20
(B) 20-30
(C) 15-20
(D) Both (A) and (B)
Answer : B
16 Find the arithmetic mean of 30,36,39,23 and 27.
(A) 28
(B) 20
(C) 31
(D) 35
Answer : C
17 The median of given observations arranged in ascending order is 25.
11, 13, 15, 19, p + 2, p + 4, 30, 35, 39, 46 .
Find p.
(A) 22
(B) 24
(C) 21
(D) 26
Answer : A
18 Which one of the following is not a measure of central tendency?
(A) Mean
(B) Range
(C) Median
(D) Mode
Answer : B
(19-22): The following is a chart showing the temperature of a patient recorded at different times.
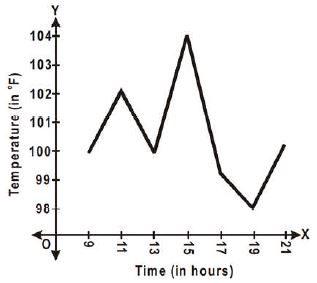
Read the temperature chart and answer the given questions.
19 What is the temperature of the patient at 21 hrs?
(A) 100° F
(B) 101° F
(C) 102° F
(D) 103° F
Answer : A
20 What is the percent age increase in temperature between 9 hrs and 15 hrs?
(A) 4%
(B) 3%
(C) 2%
(D) 1%
Answer : A
21 What is the percentage decrease in temperature between 17 hrs and 19 hrs?
(A) 1.02%
(B) 1.03%
(C) 1.04%
(D) 1.01%
Answer : D
22 What is the average temperature of the patient between 13, 15 and 17 hrs?
(A) 103 °F
(B) 102 °F
(C) 101 °F
(D) 100 °F
Answer : B
23 The mean of first 8 observations is 18 and last 8 observations is 20.1f the mean of all 15 observations is 19, find the 8th observat ion.
(A) 18
(B) 12
(C) 19
(D) 20
Answer : C
24 A grouped frequency distribution table with classes of equal sizes using 63 - 72 (72 included) as one of the classes is constructed for the following data.
30,32,45, 54, 74, 78,108,112, 66, 76,88, 40, 14,20, 15,35,44, 66, 75,84,96, 102, 110, 88, 74, 112, 14, 34, 44
Find the number of classes in the distribution.
(A) 9
(B) 11
(C) 10
(D) 12
Answer : B
25 The mid-point of a class is m and l is the upper class limit in a continuous frequency distribution. Which of the following would be the lower class limit of the class?
(A) 2m + l
(B) 2m - l
(C) m - l
(D) m - 2l
Answer : B
26 The width of each of nine classes in a frequency distribution is 2.5 and the lower class boundary of the lowest class is 1 0.6. What is the upper class boundary of the highest class?
(A) 35.6
(B) 33.1
(C) 30.3
(D) 28.1
Answer : B
27 In a frequency distribution, the mid value of a class is 10 and the width of the class is 6. What is the lower limit of the class?
(A) 6
(B) 7
(C) 8
(D) 12
Answer : B
28 In afrequency distribution, ogives are graphical representation of which of the following?
(A) Fr equency
(B) Relative frequency
(C) Cumulative frequency
(D) Raw data
Answer : C
29 Apart from plotting frequencies of the class intervals, which of the following are used to construct a frequency polygon?
(A) Upper limits of the classes
(B) Lower limits of the classes
(C) Any values of the classes
(D) Mid values of the classes
Answer : D
30 The mean wage of 150 labourers working in a factory running three shifts with 60,
40 and 50 labourers is ₹ 114. The mean wage of 60 labourers working in the first shift is ₹ 121.50 and that of 40 labourers working the second shift is ₹ 107.75. Find the mean wage of those who are working in the third shift.
(A) ₹ 110
(B) ₹ 100
(C) ₹ 120
(D) ₹ 115.75
Answer : A
31 The mean of n observations is X¯. If each observation is multiplied by k, what is the mean of new observations?
(A) kX¯
(B) x¯/k
(C) X¯ + k
(D) X¯ - k
Answer : A
32 The mean of 75 numbers is 25. If each number is divided by 5, find the new mean.
(A) 5
(B) 20
(C) 8
(D) 15
Answer : A
33 For which set of numbers do the mean, median and mode have the same value?
(A) 2,2, 2,4
(B) 1, 3, 3, 3, 5
(C) 1, 1, 2, 5, 6
(D) 1, 1, 1,2,5
Answer : B
34 Find the difference between arithmetic means of all even and odd numbers between 50 and 60.
(A) 2
(B) 0
(C) 1
(D) 3
Answer : B
35 For the set of numbers 2, 2, 4, 5 and 12 which of the following statements is true?
(A) Mean = Median
(B) Mean > Mode
(C) Mean < Mode
(D) Mode = Median
Answer : B
36 A cricketer has a mean score of 60 runs in ten innings. Find the number of runs that are to be scored in the eleventh inning to raise the mean score to 62.
(A) 62
(B) 78
(C) 58
(D) 82
Answer : D
37 Which of the following is the empirical relation between mean, mode and median?
(A) Mode= 3 Median - 2 Mean
(B) Mode= 2 Median - 3 Mean
(C) Median= 3 Mode - 2 Mean
(D) Mean = 3 Median - 2 Mode
Answer : A
38 Find the median of the data given.
(0, 2 , 2, 2, -3, 5, - 1, 5, 5, -3, 6, 6, 5, 6)
(A) 0
(B) - 1.5
(C) 2
(D) 3.5
Answer : D
39 The mean of 20 n umbers is 40. If 5 is subtracted f rom every number, what w ill be the new mean?
(A) 45
(B) 40
(C) 20
(D) 35
Answer : D
40 The mean of a, b, c, d and e is 28. If the mean of a, c, and e is 24, what is the mean of band d?
(A) 31
(B) 32
(C) 33
(D) 34
Answer : D
41 What is the algebraic sum of the deviations of a set of n values from their mean?
(A) 0
(B) n - 1
(C) n
(D) n + 1
Answer : A
42 The mean of 50 observations was 250. It was detected on checking that the value of 165 was wrongly copied as 115 for computation of mean. Find the correct mean.
(A) 215
(B) 151
(C) 156
(D) 251
Answer : D
43 The mean of the data x1, x2' x3, ..... , xn is 'a:
Find the mean of the data X1 + a ,x2 + a, X3 + a1 '"I Xn + a
(A) a+ a
(B) a a
(C) a+ a
(D) a - a
Answer : C
44 If the mean of 9 observations p, p + 2, p + 4, p + 6, p + 8, p- 2, p - 4, p - 6 and p - 8 is 10. Find the mean of the least 5 observations.
(A) 6
(B) 25
(C) 10
(D) 9
Answer : A
45 The median of the data 26, 56, 32, 33, 60, 17, 34, 29, 45, is 33. If 26 is replaced with 62, what is the new median?
(A) 34
(B) 29
(C) 32
(D) 33
Answer : A
46 The mean of 6 numbers is 20. If one number is deleted, their mean is 15. Find the deleted number.
(A) 45
(B) 52
(C) 20
(D) 36
Answer : A
47 The number of children in 10 families of a locality are 1, 4, 3, 3, 4, 2, 2, 3, 3 and 5.
Find the mean number of children per family.
(A) 3
(B) 4
(C) 1
(D) 2
Answer : A
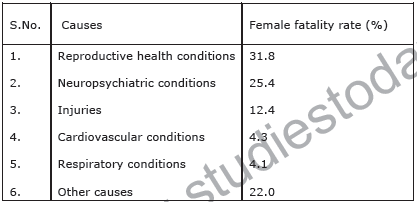
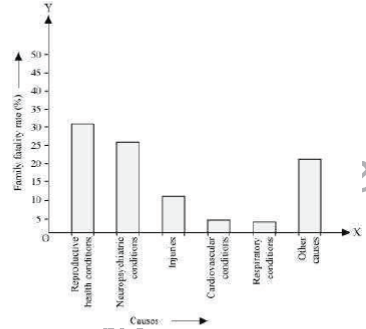
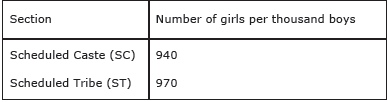
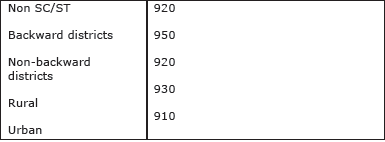
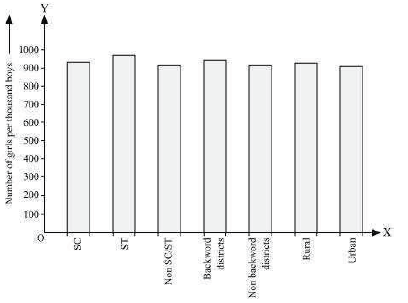
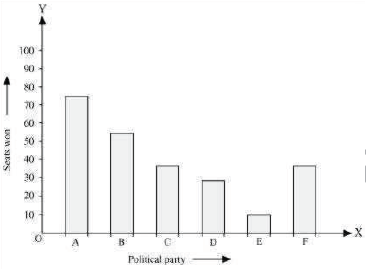
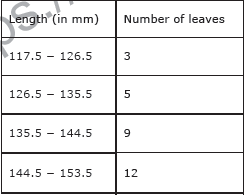
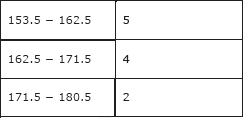
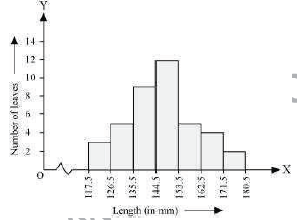

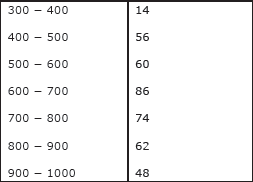
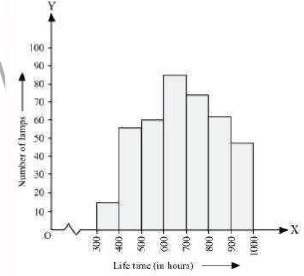
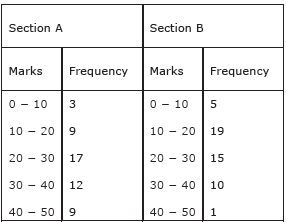
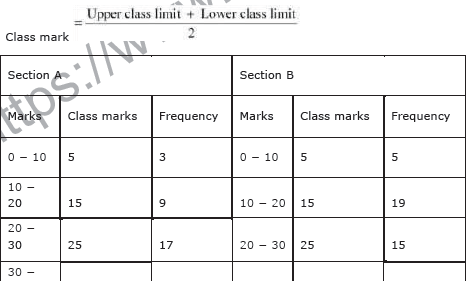

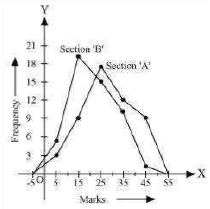

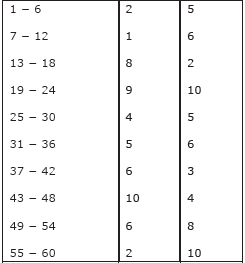
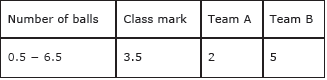
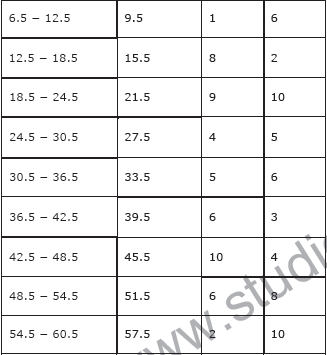
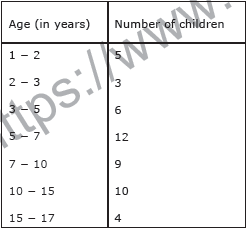
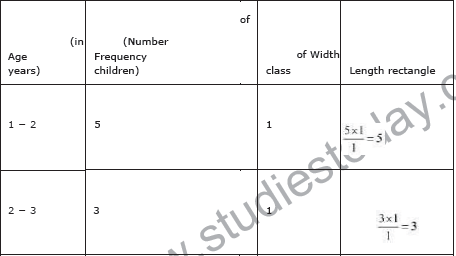
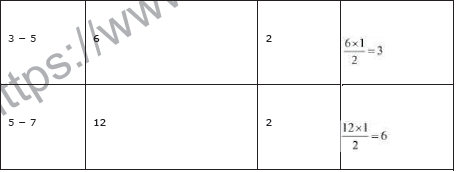
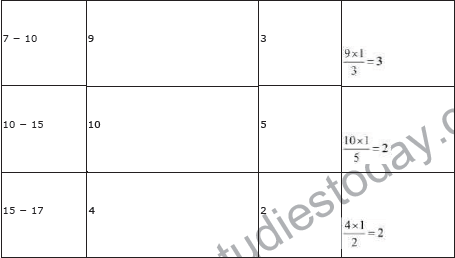
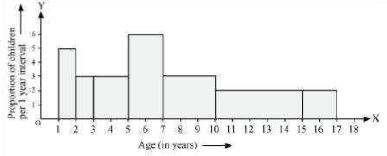
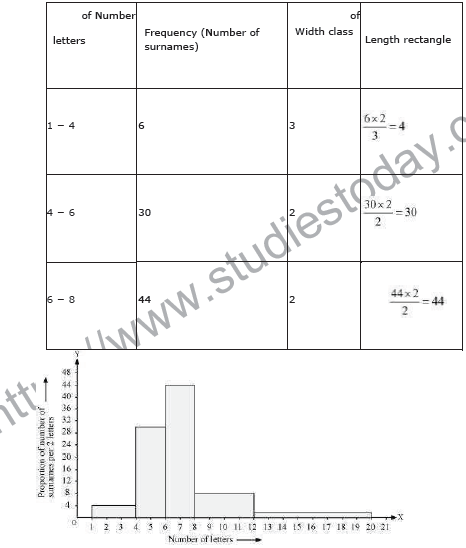
Taking the age of children on x-axis and proportion of children per 1 year interval on y-axis, the histogram can be drawn as follows.
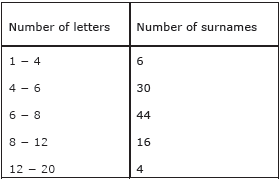
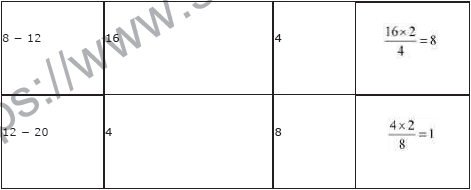
Short Answer Type questions
Question 1. Define array or arrayed data.
Answer: An array or arrayed data refers to raw numerical information that has been organized in a specific order, either from lowest to highest or highest to lowest.
In simple words: It means putting a list of numbers in order from smallest to biggest, or biggest to smallest.
Exam Tip: In your definition, make sure to mention both ascending and descending order to secure full marks.
Question 2. Define frequency.
Answer: Frequency represents the total number of times a specific value or observation appears within a collected dataset.
In simple words: It is simply how many times a certain number or item shows up in a list.
Exam Tip: Always define frequency in relation to an "observation" or "data value" to satisfy examiners.
Question 3. Write the relation between class mark, lower limit and upper limit of a class interval.
Answer: The class mark is calculated by finding the average of the lower limit and the upper limit of that class interval.
Formula: \( \text{Class Mark} = \frac{\text{Lower Limit} + \text{Upper Limit}}{2} \)
In simple words: To find the class mark, add the smallest and largest numbers of a group together, then divide by 2.
Exam Tip: Expressing this relation as a clear mathematical formula alongside the verbal explanation is highly recommended for full credit.
Question 4. Define primary data.
Answer: Primary data refers to first-hand information gathered directly by an investigator for a specific, pre-determined objective.
In simple words: This is data that you collect yourself from scratch, like going around and asking people questions directly.
Exam Tip: Use the term "first-hand" and highlight that it is collected directly by the researcher to get maximum marks.
Question 5. Define secondary data. How it is differ from the primary data?
Answer: Secondary data is information that has already been gathered, compiled, and published by someone else for another purpose. It differs from primary data because primary data is fresh, original information collected directly from the source, while secondary data is second-hand information taken from existing resources like journals, websites, or reports.
In simple words: Secondary data is information you get from books, websites, or other people's work, rather than finding it out yourself. Primary data is brand new, while secondary data already exists.
Exam Tip: Clearly contrast "first-hand collection" versus "using pre-existing sources" when explaining the difference.
Question 6. Find the mode of the following data :
| Marks | Number of students |
|---|---|
| 48 | 4 |
| 49 | 10 |
| 50 | 12 |
| 51 | 10 |
| 52 | 10 |
How many students are there whose marks are less than the modal value?
Answer: By examining the given frequency table, we can see that the mark with the highest frequency of 12 is 50. Thus, the modal mark is 50.
To find the number of students scoring less than this modal value, we add the frequencies of marks below 50 (which are 48 and 49):
\( \text{Number of students} = 4 + 10 = 14 \)
In simple words: The mode is 50 because it has the most students (12). There are 14 students who got marks lower than 50 (4 students got 48, and 10 students got 49).
Exam Tip: Always state the definition of mode (value with maximum frequency) before writing down the final numerical value.
Question 7. Following data represents the favourite fruit liked by 20 children. P G A M M P A M G M A M M M M M A A P G. Make a frequency table to find how many more children chose apple as their favourite fruit than pomegranate.
Answer: First, let us list the choices and count the frequency of each fruit:
| Fruit | Tally Marks | Frequency (Number of Children) |
|---|---|---|
| Mango (M) | |||| |||| | 9 |
| Grapes (G) | ||| | 3 |
| Apple (A) | |||| | 5 |
| Pomegranate (P) | ||| | 3 |
| Total | 20 |
From the frequency table:
- Children preferring Apple = 5
- Children preferring Pomegranate = 3
Difference = 5 - 3 = 2.
Therefore, 2 more children preferred apple over pomegranate.
In simple words: We count each fruit: Mango has 9, Grapes 3, Apple 5, and Pomegranate 3. Since 5 kids chose apple and 3 chose pomegranate, 2 more kids like apple better than pomegranate.
Exam Tip: In tally chart questions, make sure to show both the tally marks column and the final numeric frequency column to avoid losing marks.
Question 8. Make a bar graph of the given data.
| Instrument | Frequency |
|---|---|
| clarinet | 11 |
| flute | 18 |
| trumpet | 7 |
| violin | 5 |
Answer: The bar graph representing the frequency of the instruments is as follows: In simple words: This bar graph shows each instrument along the bottom, and how high the bars go shows how many children play them.
Exam Tip: Always choose a uniform scale for the y-axis, label both axes clearly, and mention the scale used at the corner of your graph paper.
Question 9. Following frequency table represents the number of students in each section of class 9th of ABC school. Find the mean number of students per sections.
| Section | Number of Student Per Section |
|---|---|
| Section A | 20 |
| Section B | 18 |
| Section C | 25 |
| Section D | 22 |
| Section E | 20 |
Answer: To find the mean number of students per section, we sum the total number of students in all five sections and then divide by the total number of sections (5):
\( \text{Total students} = 20 + 18 + 25 + 22 + 20 = 105 \)
\( \text{Number of sections} = 5 \)
\( \text{Mean} = \frac{105}{5} = 21 \)
Thus, the mean number of students per section is 21.
In simple words: Add up all the students in the five classrooms to get 105. Then divide by 5 to find that there are about 21 students in each class on average.
Exam Tip: Write down the general formula \( \text{Mean} = \frac{\sum x_i}{n} \) before putting in the values to maximize step-wise marks.
Question 10. The table below shows the age of seven students participating in a music recital. Find the median and mode of the data.
| Age (years) | ||||||
|---|---|---|---|---|---|---|
| 12 | 10 | 9 | 10 | 11 | 8 | 13 |
Answer: First, arrange the given ages of the seven students in ascending order:
8, 9, 10, 10, 11, 12, 13
Since the total number of observations is \( n = 7 \) (an odd number), the median is the \( \frac{7 + 1}{2} \)-th, which is the 4th value:
\( \text{Median} = 10 \text{ years} \)
The value that appears most frequently is 10 (occurring twice). Therefore, the mode of the data is also 10 years.
In simple words: Line the ages up in order: 8, 9, 10, 10, 11, 12, 13. The middle age is 10 (the median). The age that shows up the most times is also 10 (the mode).
Exam Tip: Never calculate the median without sorting the raw data in ascending or descending order first.
Question 11. Find the median and mode of the speeds displayed in the graph.
Answer: The speeds of the vehicles A, B, C, D, E, F, G, H as shown in the bar graph are:
67, 70, 92, 67, 82, 89, 70, 87
To find the median, we first arrange these 8 values in ascending order:
67, 67, 70, 70, 82, 87, 89, 92
Since \( n = 8 \) is even, the median is the average of the \( \frac{8}{2} \)-th (4th) and \( \left(\frac{8}{2} + 1\right) \)-th (5th) values:
- 4th value = 70 km/h
- 5th value = 82 km/h
\( \text{Median} = \frac{70 + 82}{2} = 76 \text{ km/h} \)
The values that repeat with the highest frequency are 67 (twice) and 70 (twice). Thus, the data set is bimodal with modes:
\( \text{Modes} = 67 \text{ km/h and } 70 \text{ km/h} \)
In simple words: Sort the speeds in order. The middle falls between 70 and 82, so the median is halfway, which is 76. Both 67 and 70 appear twice, which is more than any other speed, so both are modes.
Exam Tip: If two values have the same maximum frequency, state both as modes and label the dataset as "bimodal" to ensure full marks.
Question 12. Make the frequency polygon of the given data.
| Class-Intervals | Frequency |
|---|---|
| 0 - 10 | 9 |
| 10 - 20 | 14 |
| 20 - 30 | 8 |
| 30 - 40 | 10 |
| 40 - 50 | 9 |
Answer: First, we find the class marks (mid-points) for each class interval to plot the polygon:
- For 0-10: class mark = 5, point = (5, 9)
- For 10-20: class mark = 15, point = (15, 14)
- For 20-30: class mark = 25, point = (25, 8)
- For 30-40: class mark = 35, point = (35, 10)
- For 40-50: class mark = 45, point = (45, 9)
To complete the polygon down to the x-axis, we add the class marks of imaginary classes with zero frequency at both ends: (-5, 0) and (55, 0). In simple words: Find the center of each interval group (5, 15, 25, etc.) and mark how high the frequency goes for each. Connect these dots with straight lines to make the polygon.
Exam Tip: Never forget to close the frequency polygon at both ends by extending the line to the class marks of imaginary intervals with zero frequency.
Question 13. The weights of new born babies (in kg) in a hospital on a particular day are as follows: 2.3, 2.2, 2.1, 2.7, 2.6, 3.0, 2.5, 2.9, 2.8, 3.1, 2.5, 2.8, 2.7, 2.9, 2.4.
1. Determine the range.
2. How many babies have weight below 2.5 kg.
3. How many babies have weight more than 2.8 kg.
Answer: Let us analyze the dataset of 15 weights:
1. The minimum weight is 2.1 kg and the maximum weight is 3.1 kg.
\( \text{Range} = \text{Maximum weight} - \text{Minimum weight} = 3.1 - 2.1 = 1.0 \text{ kg} \)
2. The weights strictly less than 2.5 kg are: 2.1, 2.2, 2.3, and 2.4.
Thus, there are 4 babies with a weight below 2.5 kg.
3. The weights strictly greater than 2.8 kg are: 2.9, 2.9, 3.0, and 3.1.
Thus, there are 4 babies with a weight more than 2.8 kg.
In simple words: 1. The difference between the heaviest baby (3.1 kg) and the lightest baby (2.1 kg) is 1.0 kg. 2. There are 4 babies that weigh less than 2.5 kg. 3. There are 4 babies that weigh more than 2.8 kg.
Exam Tip: Be careful with boundaries — terms like "below 2.5" or "more than 2.8" do not include 2.5 and 2.8 themselves.
Question 14. The class- marks of a distribution are 26,31,36,41,46,51,56,61,66,71.Find the true class limits.
Answer: Let us find the difference between any two consecutive class marks:
\( h = 31 - 26 = 5 \)
The class size is 5. To determine the true class limits for each class mark \( x \), we use:
- Lower Limit = \( x - \frac{h}{2} = x - 2.5 \)
- Upper Limit = \( x + \frac{h}{2} = x + 2.5 \)
The true class limits are calculated as follows:
| Class Mark | True Class Limits (Interval) |
|---|---|
| 26 | 23.5 - 28.5 |
| 31 | 28.5 - 33.5 |
| 36 | 33.5 - 38.5 |
| 41 | 38.5 - 43.5 |
| 46 | 43.5 - 48.5 |
| 51 | 48.5 - 53.5 |
| 56 | 53.5 - 58.5 |
| 61 | 58.5 - 63.5 |
| 66 | 63.5 - 68.5 |
| 71 | 68.5 - 73.5 |
In simple words: The class marks go up by 5 each time. To find the starting and ending points of each group, go down by 2.5 and up by 2.5 from each class mark.
Exam Tip: Showing the table containing both the class marks and their calculated boundaries ensures a structured presentation that examiners prefer.
Question 15. The bar graph shown in figure represents the circulation of newspaper in 5 languages. Study the bar graph and answer the following questions:
(i) What is the total number of newspapers published in Hindi, English, Urdu, Punjabi and Bengali?
(ii) State the language in which the largest number of news papers is published.
(iii) State the language in which the number of newspapers published is minimum.
Answer: Reading the values from the bar graph:
- Urdu = 200
- Hindi = 700
- Punjabi = 400
- English = 900
- Bengali = 300
(i) Total number of newspapers = 700 (Hindi) + 900 (English) + 200 (Urdu) + 400 (Punjabi) + 300 (Bengali) = 2,500.
(ii) The tallest bar is for English with 900 publications. Therefore, the largest number of newspapers is published in English.
(iii) The shortest bar is for Urdu with 200 publications. Therefore, the minimum number of newspapers is published in Urdu.
In simple words: (i) Adding all the newspaper counts together gives 2,500. (ii) English has the most newspapers with 900. (iii) Urdu has the fewest newspapers with only 200.
Exam Tip: Double check the alignment of the top of each bar with the markings on the vertical y-axis using a ruler to prevent reading errors.
Question 16. Prepare a frequency distribution from the following data by taking the class intervals.
| Mid points | Frequency |
|---|---|
| 5 | 3 |
| 15 | 9 |
| 25 | 15 |
| 35 | 10 |
| 45 | 6 |
| 55 | 4 |
Answer: The mid-points are separated by a difference of 10 (15 - 5 = 10), so the class size is \( h = 10 \).
The lower and upper limit for each mid-point \( m \) is given by \( m - 5 \) to \( m + 5 \). The frequency distribution is:
| Class Interval | Frequency |
|---|---|
| 0 - 10 | 3 |
| 10 - 20 | 9 |
| 20 - 30 | 15 |
| 30 - 40 | 10 |
| 40 - 50 | 6 |
| 50 - 60 | 4 |
| Total | 47 |
In simple words: The centers of the groups go up by 10 each time. To build the groups, we go 5 below and 5 above each center, giving intervals like 0 to 10, 10 to 20, and so on.
Exam Tip: Verify that the sum of frequencies in your converted table matches the total given in the question (47) to catch any copying mistakes.
Question 17. Mean of 18 numbers is 57. If 9 is added to each number, find the new mean.
Answer: Let the 18 numbers be \( x_1, x_2, \dots, x_{18} \). The original mean is:
\( \bar{x} = \frac{\sum x_i}{18} = 57 \)
When 9 is added to each observation, the new numbers are \( (x_i + 9) \). The new mean is:
\( \text{New Mean} = \frac{\sum (x_i + 9)}{18} = \frac{\sum x_i + 18 \times 9}{18} = \frac{\sum x_i}{18} + 9 = 57 + 9 = 66 \)
Thus, the new mean is 66.
In simple words: If you add 9 to every single number in a list, the average of those numbers will also increase by exactly 9. So the new average is 57 + 9 = 66.
Exam Tip: Remember the property that if a constant \( k \) is added to each value, the mean also increases by \( k \). Stating this property directly can save time during examinations.
Question 18. Prove that the sum of the deviations of individual observations from their mean is zero.
Answer: Let \( x_1, x_2, \dots, x_n \) be \( n \) observations with mean \( \bar{x} \). By definition of the mean:
\( \bar{x} = \frac{1}{n} \sum_{i=1}^{n} x_i \implies \sum_{i=1}^{n} x_i = n\bar{x} \)
The deviation of any observation \( x_i \) from the mean is \( (x_i - \bar{x}) \). Summing these deviations:
\( \sum_{i=1}^{n} (x_i - \bar{x}) = \sum_{i=1}^{n} x_i - \sum_{i=1}^{n} \bar{x} \)
Since \( \bar{x} \) is a constant, \( \sum_{i=1}^{n} \bar{x} = n\bar{x} \). Substituting this in the equation:
\( \sum_{i=1}^{n} (x_i - \bar{x}) = n\bar{x} - n\bar{x} = 0 \)
Hence proved.
In simple words: When you calculate the difference between each number in a set and their average, some differences are positive and some are negative. Adding them all up always cancels out to exactly zero.
Exam Tip: Be sure to write the summation limits clearly to demonstrate complete mathematical rigor in proofs.
Question 19. The median of the following observation arranged in ascending order is 22. Find x. 8, 11, 13, 15, x+1, x+3, 30, 35, 40, 43
Answer: The observations are already in ascending order:
8, 11, 13, 15, \( x+1 \), \( x+3 \), 30, 35, 40, 43
The total number of terms is \( n = 10 \) (even). Therefore, the median is the average of the 5th and 6th terms:
\( \text{Median} = \frac{\text{5th term} + \text{6th term}}{2} \)
\( 22 = \frac{(x + 1) + (x + 3)}{2} \)
\( 22 = \frac{2x + 4}{2} \)
\( 22 = x + 2 \)
\( x = 20 \)
In simple words: There are 10 numbers, so the median is halfway between the 5th number (x + 1) and the 6th number (x + 3). The average of these two is x + 2. Since the median is 22, x must be 20.
Exam Tip: For an even number of observations, clearly show the formula using the terms \( \frac{n}{2} \) and \( \frac{n}{2} + 1 \) before doing calculations.
Question 20. 1. If the mean of the following data is 20.2, find the value of p:
| X | 10 | 15 | 20 | 25 | 30 |
|---|---|---|---|---|---|
| f | 6 | 8 | p | 10 | 6 |
Answer: Let us tabulate the products of the values \( X \) and their frequencies \( f \):
| \( X \) | \( f \) | \( f \cdot X \) |
|---|---|---|
| 10 | 6 | 60 |
| 15 | 8 | 120 |
| 20 | p | 20p |
| 25 | 10 | 250 |
| 30 | 6 | 180 |
| Total | \( \sum f = 30 + p \) | \( \sum f \cdot X = 610 + 20p \) |
Given that the mean is 20.2:
\( \text{Mean} = \frac{\sum f \cdot X}{\sum f} \)
\( 20.2 = \frac{610 + 20p}{30 + p} \)
\( 20.2(30 + p) = 610 + 20p \)
\( 606 + 20.2p = 610 + 20p \)
\( 20.2p - 20p = 610 - 606 \)
\( 0.2p = 4 \)
\( p = 20 \)
In simple words: Multiply each X by its frequency f, and add them up to get 610 + 20p. Also, add the frequencies together to get 30 + p. Setting the ratio equal to 20.2 allows us to solve for p, which is 20.
Exam Tip: Be meticulous while expanding brackets during the algebraic cross-multiplication step to prevent basic arithmetic errors.
Question 21. The water bills of 32 houses in a colony for a period is given below : 56, 43, 32, 38, 56, 22 ,68, 85, 52, 47, 35, 58, 63, 74, 27, 84, 69, 35, 44, 75, 55, 30, 54, 65, 45, 67, 95, 72, 43, 65, 35, 59 . Tabulate the data and present the data as a cumulative frequency table using 70-79 as one of the class intervals.
Answer: We group the 32 water bill values using inclusive class intervals of width 10, beginning with 20-29. Then we calculate the frequency and cumulative frequency (less than type) for each class interval:
| Class Interval | Tally Marks | Frequency | Cumulative Frequency |
|---|---|---|---|
| 20 - 29 | || | 2 | 2 |
| 30 - 39 | |||| | | 6 | 8 |
| 40 - 49 | |||| | 5 | 13 |
| 50 - 59 | |||| || | 7 | 20 |
| 60 - 69 | |||| | | 6 | 26 |
| 70 - 79 | ||| | 3 | 29 |
| 80 - 89 | || | 2 | 31 |
| 90 - 99 | | | 1 | 32 |
| Total | 32 |
In simple words: Sort the houses' water bills into groups like 20-29, 30-39, and so on. The cumulative frequency column keeps a running total of the houses as you go down the list.
Exam Tip: Verify that the final cumulative frequency value matches the total number of houses given in the question (32) to ensure no values were skipped.
Question 22. Construct a frequency polygon for the following data:
| Age ( in years) | Frequency |
|---|---|
| 0 - 2 | 4 |
| 2 - 4 | 2 |
| 4 - 6 | 12 |
| 6 - 8 | 18 |
| 8 - 10 | 25 |
Answer: First, find the class marks (mid-points) for each interval to plot the points:
- 0-2: class mark = 1, point = (1, 4)
- 2-4: class mark = 3, point = (3, 2)
- 4-6: class mark = 5, point = (5, 12)
- 6-8: class mark = 7, point = (7, 18)
- 8-10: class mark = 9, point = (9, 25)
To close the frequency polygon on the x-axis, we add class marks of zero-frequency imaginary classes at both ends: (-1, 0) and (11, 0). In simple words: Mark a dot at the middle of each age interval (like 1, 3, 5, etc.) showing the frequency, and draw straight lines connecting all these dots together.
Exam Tip: Be sure to write out the table of mid-points (class marks) alongside your polygon so the teacher can see your working clearly.
Question 23. The population of a state in different census years is as given below:
| Census year | 1981 | 1982 | 1983 | 1984 | 1985 |
|---|---|---|---|---|---|
| Population in Lakhs | 30 | 50 | 70 | 110 | 150 |
Represent the above information with the help of bar graph.
Answer: The bar graph representing the state population across census years is as follows: In simple words: Draw bars for each year. The height of each bar shows how many lakhs of people live in that state, with 1985 being the highest bar at 150.
Exam Tip: Be sure to write the scale used (e.g., "Scale: 1 cm = 40 Lakhs on y-axis") clearly in the top-right corner of your graph.
Question 24. The average marks of boys in an examination are 65 and that of girls is 74. If the average of marks of all candidates in that examination is 70, find the ratio of the number of boys to the number of girls that appeared in the examination.
Answer: Let the number of boys be \( n_1 \) and the number of girls be \( n_2 \).
Given:
- Mean marks of boys (\( \bar{x}_1 \)) = 65
- Mean marks of girls (\( \bar{x}_2 \)) = 74
- Combined mean marks of all candidates (\( \bar{x} \)) = 70
Using the combined mean formula:
\( \bar{x} = \frac{n_1\bar{x}_1 + n_2\bar{x}_2}{n_1 + n_2} \)
\( 70 = \frac{65n_1 + 74n_2}{n_1 + n_2} \)
\( 70(n_1 + n_2) = 65n_1 + 74n_2 \)
\( 70n_1 + 70n_2 = 65n_1 + 74n_2 \)
\( 70n_1 - 65n_1 = 74n_2 - 70n_2 \)
\( 5n_1 = 4n_2 \)
\( \frac{n_1}{n_2} = \frac{4}{5} \)
Therefore, the ratio of the number of boys to the number of girls is 4 : 5.
In simple words: Let the number of boys be B and the number of girls be G. The combined average equation gives B/G = 4/5, which means there are 4 boys for every 5 girls.
Exam Tip: Clearly state what your variables \( n_1 \) and \( n_2 \) stand for at the beginning of your calculation to prevent examiner confusion.
Question 25. 1. The marks obtained (out of 100) by a class of 80 students are given below:
| Marks | Number of students |
|---|---|
| 10-20 | 6 |
| 20-30 | 17 |
| 30-50 | 15 |
| 50-70 | 16 |
| 70-100 | 26 |
Construct a histogram to represent the data above.
Answer: Because the class intervals have unequal widths, we must adjust the frequencies (frequency density) before drawing the histogram. The minimum class width is 10.
\( \text{Adjusted Frequency} = \frac{\text{Frequency of the class}}{\text{Width of the class}} \times \text{Minimum class width} \)
| Class Interval | Width | Frequency | Adjusted Frequency |
|---|---|---|---|
| 10 - 20 | 10 | 6 | \( \frac{6}{10} \times 10 = 6 \) |
| 20 - 30 | 10 | 17 | \( \frac{17}{10} \times 10 = 17 \) |
| 30 - 50 | 20 | 15 | \( \frac{15}{20} \times 10 = 7.5 \) |
| 50 - 70 | 20 | 16 | \( \frac{16}{20} \times 10 = 8 \) |
| 70 - 100 | 30 | 26 | \( \frac{26}{30} \times 10 \approx 8.67 \) |
The histogram with adjusted frequencies is shown below:
In simple words: Since the groups are not all the same size, we have to adjust the heights of the bars so they match correctly. A wider group's height is adjusted downwards relative to its frequency.
Exam Tip: For unequal class intervals, remember that the area of each bar (not the height) is proportional to its frequency. You must use the adjusted frequency calculation table to earn full marks.
Question 26. 1. Draw a histogram for the following distribution:
| Marks obtained | 0-10 | 10-20 | 20-30 | 30-40 | 40-50 | 50-60 | 60-70 | 70-80 |
|---|---|---|---|---|---|---|---|---|
| No. of Students | 7 | 10 | 6 | 8 | 12 | 3 | 2 | 2 |
Answer: Because the class intervals have equal widths of 10, we can directly plot the frequencies as the heights of the bars:
In simple words: Draw bars side-by-side. The height of each bar represents the number of students who got marks in that specific range, with 40-50 being the highest bar.
Exam Tip: Since this has equal class widths, no adjusted frequency is needed. Ensure the bars are drawn touching each other with no gaps between them.
Most Important Questions
Question 1. List the different types of statistical data.
Answer: There are two major categories of statistical data:
1. Primary Data - Original data compiled directly from the source by the investigator.
2. Secondary Data - Pre-existing data obtained from other published or unpublished sources.
In simple words: The two types of data are primary data (which you find out yourself) and secondary data (which you get from books or websites).
Exam Tip: To score full marks, briefly explain each type alongside the list.
Question 2. List the different types of frequency distribution.
Answer: Frequency distributions are generally grouped into two types:
1. Ungrouped (or discrete) frequency distribution, where individual data points are listed with their respective frequencies.
2. Grouped (or continuous) frequency distribution, where data is organized into class intervals along with corresponding frequencies.
In simple words: The two main types of frequency distribution are ungrouped tables (for separate, single numbers) and grouped tables (where numbers are in interval classes, like 0-10).
Exam Tip: Giving a small example of each category can help secure extra marks for clear conceptual understanding.
Question 3. List the different ways for the presentation of raw data.
Answer: Raw data can be displayed in several ways to make it easy to understand:
1. Narrative or textual presentation
2. Tabular presentation (such as discrete or grouped frequency tables)
3. Visual or graphical presentation (including bar charts, histograms, and frequency polygons)
In simple words: You can show raw data by writing it as a paragraph, organizing it in a table, or drawing it as a chart.
Exam Tip: Always list all three ways — textual, tabular, and graphical — to provide a complete answer.
Question 4. Given below are the ages of 25 students of class IX in a school. Prepare a discrete frequency distribution. 15, 16, 16, 14, 17, 17, 16, 15, 15, 16, 16, 17, 15, 16, 16, 14, 16, 15, 14, 15, 16, 16, 15, 14, 15.
Answer: We count how many times each age appears in the given list of 25 students to build the discrete frequency distribution table:
| Age (in years) | Tally Marks | Frequency (Number of students) |
|---|---|---|
| 14 | |||| | 4 |
| 15 | |||| ||| | 8 |
| 16 | |||| |||| | 10 |
| 17 | ||| | 3 |
| Total | 25 |
In simple words: We go through the list and count: there are four 14s, eight 15s, ten 16s, and three 17s. We write these counts down in a table.
Exam Tip: Use tally marks to help you count raw datasets systematically without missing any values.
Question 5. What is data? Explain the types of statistical data?
Answer: Data is defined as a systematic collection of facts, numbers, figures, or observations gathered to gain information on a specific subject. Statistical data is classified into two primary categories:
1. Primary Data: Information collected directly by the researcher for the very first time. It is highly reliable and specific to the research goal.
2. Secondary Data: Information that was previously gathered and recorded by another party for a different purpose, which is now being used for current analysis.
In simple words: Data is just a list of facts and numbers. Primary data is collected directly by yourself, whereas secondary data is retrieved from existing books or reports.
Exam Tip: Use terms like "first-hand information" and "second-hand information" to quickly define both types of data clearly.
Question 6. The class marks of a distribution are 26, 31, 36, 41, 46, 51, 56, 61, 66, 71. Determine the true class limits.
Answer: The consecutive class marks differ by:
\( h = 31 - 26 = 5 \)
So, the class size is 5. We calculate the class limits for each class mark \( x \) using:
- Lower Limit = \( x - \frac{h}{2} = x - 2.5 \)
- Upper Limit = \( x + \frac{h}{2} = x + 2.5 \)
The true class limits table is:
| Class Mark | True Class Limits |
|---|---|
| 26 | 23.5 - 28.5 |
| 31 | 28.5 - 33.5 |
| 36 | 33.5 - 38.5 |
| 41 | 38.5 - 43.5 |
| 46 | 43.5 - 48.5 |
| 51 | 48.5 - 53.5 |
| 56 | 53.5 - 58.5 |
| 61 | 58.5 - 63.5 |
| 66 | 63.5 - 68.5 |
| 71 | 68.5 - 73.5 |
In simple words: The class marks go up by 5. We go 2.5 below and 2.5 above each mark to find the boundaries of each group.
Exam Tip: Clearly show the calculation of class size \( h \) to obtain full marks for your steps.
Question 7. Form a grouped frequency distribution from the following data by inclusive method taking 4 as the magnitude of class intervals. 31, 23, 19, 29, 22, 20, 16, 10, 13, 34, 38, 33, 28, 21, 15, 18, 36, 24, 18, 15, 12, 30, 27, 23, 20, 17, 14, 32, 26, 25, 18, 29, 24, 19, 16, 11, 22, 15, 17, 10.
Answer: We group the 40 observations using the inclusive method with class intervals of size 4. Since the minimum value is 10, our intervals are 10-13, 14-17, and so on:
| Class Interval | Tally Marks | Frequency |
|---|---|---|
| 10 - 13 | |||| | 5 |
| 14 - 17 | |||| ||| | 8 |
| 18 - 21 | |||| ||| | 8 |
| 22 - 25 | |||| || | 7 |
| 26 - 29 | |||| | 5 |
| 30 - 33 | |||| | 4 |
| 34 - 37 | || | 2 |
| 38 - 41 | | | 1 |
| Total | 40 |
In simple words: We place the 40 numbers into groups of 4 (like 10 to 13, 14 to 17, etc.) and count how many numbers fall into each group.
Exam Tip: Remember that in the inclusive method, both the lower and upper limit numbers are counted in that same interval.
Question 8. The marks obtained by 40 students of Class IX in an examination are given below : 18, 8, 12, 6, 8, 16, 12, 5, 23, 2, 16, 23, 2, 10, 20, 12, 9, 7, 6, 5, 3, 5, 13, 21, 13, 15, 20, 24, 1, 7, 21, 16, 13, 18, 23, 7, 3, 18, 17, 16. Present the data in the form of a frequency distribution using the same class size, one such class being 20-25 (where 25 is not included).
Answer: Since 20-25 is an interval with 25 excluded, we use the exclusive continuous method with a class size of 5. The intervals are 0-5, 5-10, 10-15, and so on:
| Class Interval | Tally Marks | Frequency |
|---|---|---|
| 0 - 5 | |||| | 5 |
| 5 - 10 | |||| |||| | | 11 |
| 10 - 15 | |||| || | 7 |
| 15 - 20 | |||| |||| | 9 |
| 20 - 25 | |||| ||| | 8 |
| Total | 40 |
In simple words: We place the 40 marks into groups of 5, like 0-5, 5-10, and so on. If a student got exactly 5, they are counted in the 5-10 group, not the 0-5 group.
Exam Tip: In the exclusive method, a value equal to the upper limit of an interval is counted in the next interval class (e.g., 10 goes into 10-15, not 5-10).
Question 9. The class marks of a distribution are : 47, 52, 57, 62, 67, 72, 77, 82, 87, 92, 97, 102. Determine the class size, the class limits and the true class limits.
Answer: 1. The class size is the difference between any two consecutive class marks:
\( h = 52 - 47 = 5 \)
2. The discontinuous class limits are built around the class marks by keeping an integer gap of 1 between intervals:
45 - 49, 50 - 54, 55 - 59, 60 - 64, 65 - 69, 70 - 74, 75 - 79, 80 - 84, 85 - 89, 90 - 94, 95 - 99, 100 - 104.
3. The true class limits (continuous class boundaries) are calculated by subtracting 2.5 and adding 2.5 to each class mark:
44.5 - 49.5, 49.5 - 54.5, 54.5 - 59.5, 59.5 - 64.5, 64.5 - 69.5, 69.5 - 74.5, 74.5 - 79.5, 79.5 - 84.5, 84.5 - 89.5, 89.5 - 94.5, 94.5 - 99.5, 99.5 - 104.5.
In simple words: The class size is 5. We can write the groups with small gaps in between (like 45-49, 50-54) or as continuous groups (like 44.5-49.5, 49.5-54.5). Both types are correct depending on the system used.
Exam Tip: When asked for both class limits and true class limits, provide the discontinuous intervals for class limits, and the continuous ones for true class limits.
Question 10. 100 plants each were planted in 100 schools during Van Mahotsava. After one month, the number of plants that survived were recorded as : [100 values listed]. Represent the above data in a frequency distribution table.
Answer: Since there are 100 observations, we condense the data into grouped class intervals of size 10, beginning with 20-29 up to 90-99 using the inclusive method:
| Number of plants survived | Tally Marks | Frequency (Number of schools) |
|---|---|---|
| 20 - 29 | ||| | 3 |
| 30 - 39 | |||| |||| |||| | 14 |
| 40 - 49 | |||| |||| || | 12 |
| 50 - 59 | |||| ||| | 8 |
| 60 - 69 | |||| |||| |||| ||| | 18 |
| 70 - 79 | |||| |||| | 10 |
| 80 - 89 | |||| |||| |||| |||| ||| | 23 |
| 90 - 99 | |||| |||| || | 12 |
| Total | 100 |
In simple words: Group the schools' plant survival numbers into ranges of 10. Most schools had between 80 and 89 plants survive (23 schools total).
Exam Tip: In large data tables, cross off each number as you count it to avoid missing values or counting a number twice.
Question 11. Consider the marks obtained (out of 100 marks) by 30 students of Class IX of a school: [30 values listed]. Construct a frequency distribution table.
Answer: We count the frequency of each unique mark value obtained by the 30 students to construct an ungrouped frequency distribution table:
| Marks Obtained | Frequency (Number of students) |
|---|---|
| 10 | 1 |
| 20 | 1 |
| 36 | 3 |
| 40 | 4 |
| 50 | 3 |
| 56 | 2 |
| 60 | 4 |
| 70 | 4 |
| 72 | 1 |
| 80 | 1 |
| 88 | 2 |
| 92 | 3 |
| 95 | 1 |
| Total | 30 |
In simple words: List each score that was got in the test, and write down how many students got that exact score.
Exam Tip: For ungrouped tables, list the scores in ascending order to make the presentation clean and systematic.
Question 12. For the following data of daily wages(in rupees) received by 30 labourers in a certain factory, construct a grouped frequency distribution table by dividing the range into class intervals of equal width, each corresponding to 2 rupees, in such a way that the mid-value of the first class interval corresponds to 12 rupees. 14, 16, 16, 14, 22, 13, 15, 24, 12, 23, 14, 20, 17, 21, 22, 18, 18, 19, 20, 17, 16, 15, 11, 12, 21, 20, 17, 18, 19, 23.
Answer: The width of each class interval is 2 rupees. The mid-point of the first class interval is 12 rupees, so the first class interval is 11-13. We construct a continuous frequency distribution table (excluding upper limits):
| Class Interval | Frequency (Number of labourers) |
|---|---|
| 11 - 13 | 3 |
| 13 - 15 | 4 |
| 15 - 17 | 5 |
| 17 - 19 | 6 |
| 19 - 21 | 5 |
| 21 - 23 | 4 |
| 23 - 25 | 3 |
| Total | 30 |
In simple words: The first group goes from 11 to 13 (which averages out to 12). Since each group has a width of 2, the other groups are 13-15, 15-17, etc.
Exam Tip: Be sure to write down how you derived the first interval (11-13) using the mid-value formula to get full marks.
Question 13. Form a discrete frequency distribution from the following scores : 15, 18, 16, 20, 25, 24, 25, 20, 16, 15, 18, 18, 16, 24, 15, 20, 28, 30, 27, 16, 24, 25, 20, 18, 28, 27, 25, 24, 24, 18, 18, 25, 20, 16, 15, 20, 27, 28, 29, 16.
Answer: We count how many times each unique score value appears in the given dataset of 40 scores:
| Score | Frequency |
|---|---|
| 15 | 4 |
| 16 | 6 |
| 18 | 6 |
| 20 | 6 |
| 24 | 5 |
| 25 | 5 |
| 27 | 3 |
| 28 | 3 |
| 29 | 1 |
| 30 | 1 |
| Total | 40 |
In simple words: We go through the list of 40 numbers and write down how many times each score appears in the list.
Exam Tip: Re-sum the frequencies at the end to make sure they add up to the total count (40) given in the problem statement.
Question 14. The weights in grams of 50 oranges picked at random from a consignment are as follows : 131, 113, 82, 75, 204, 81, 84, 118, 104, 110, 80, 107, 111, 141, 136, 123, 90, 78, 90, 115, 110, 98, 106, 99, 107, 84, 76, 186, 82, 100, 109, 128, 115, 107, 115, 119, 93, 187, 139, 129, 130, 68, 195, 123, 125, 111, 92, 86, 70, 126. Form the grouped frequency table by dividing the variable range into intervals of equal width, each corresponding to 20 gms in such a way that the mid-value of the first class corresponds to 70 gms.
Answer: The class size is 20 gms. The mid-point of the first class interval is 70 gms, which means the first class interval is 60-80. We construct a continuous frequency distribution table (excluding upper limits):
| Class Interval | Frequency (Number of oranges) |
|---|---|
| 60 - 80 | 5 |
| 80 - 100 | 13 |
| 100 - 120 | 17 |
| 120 - 140 | 10 |
| 140 - 160 | 1 |
| 160 - 180 | 0 |
| 180 - 200 | 3 |
| 200 - 220 | 1 |
| Total | 50 |
In simple words: The first group goes from 60 to 80 grams (which centers at 70). We place the 50 oranges into their weight groups and write down the counts.
Exam Tip: Include the interval 160-180 with a frequency of 0 in your table to maintain a continuous, complete class interval sequence.
Question 15. The marks obtained by 35 students in an examination are given below: 370, 290, 318, 175, 170, 410, 378, 405, 380, 375, 315, 305, 325, 275, 241, 288, 261, 355, 402, 380, 178, 253, 428, 240, 210, 175, 154, 405, 380, 370, 306, 460, 328, 440, 425. Form a cumulative frequency table with class intervals of length 50.
Answer: We group the 35 scores using continuous class intervals of length 50, starting with 150-200. Then we calculate the frequency and cumulative frequency (less than type) for each class interval:
| Class Interval | Frequency | Cumulative Frequency |
|---|---|---|
| 150 - 200 | 5 | 5 |
| 200 - 250 | 3 | 8 |
| 250 - 300 | 5 | 13 |
| 300 - 350 | 6 | 19 |
| 350 - 400 | 8 | 27 |
| 400 - 450 | 7 | 34 |
| 450 - 500 | 1 | 35 |
| Total | 35 |
In simple words: Group the marks in intervals of 50 (like 150-200). The cumulative frequency keeps a running total of the students as you add each group's frequency.
Exam Tip: Be sure that your running total ends at exactly the total number of students (35) given in the question.
Free study material for Mathematics
CBSE Class 9 Mathematics Chapter 12 Statistics Assignment
Access the latest Chapter 12 Statistics assignments designed as per the current CBSE syllabus for Class 9. We have included all question types, including MCQs, short answer questions, and long-form problems relating to Chapter 12 Statistics. You can easily download these assignments in PDF format for free. Our expert teachers have carefully looked at previous year exam patterns and have made sure that these questions help you prepare properly for your upcoming school tests.
Benefits of solving Assignments for Chapter 12 Statistics
Practicing these Class 9 Mathematics assignments has many advantages for you:
- Better Exam Scores: Regular practice will help you to understand Chapter 12 Statistics properly and you will be able to answer exam questions correctly.
- Latest Exam Pattern: All questions are aligned as per the latest CBSE sample papers and marking schemes.
- Huge Variety of Questions: These Chapter 12 Statistics sets include Case Studies, objective questions, and various descriptive problems with answers.
- Time Management: Solving these Chapter 12 Statistics test papers daily will improve your speed and accuracy.
How to solve Mathematics Chapter 12 Statistics Assignments effectively?
- Read the Chapter First: Start with the NCERT book for Class 9 Mathematics before attempting the assignment.
- Self-Assessment: Try solving the Chapter 12 Statistics questions by yourself and then check the solutions provided by us.
- Use Supporting Material: Refer to our Revision Notes and Class 9 worksheets if you get stuck on any topic.
- Track Mistakes: Maintain a notebook for tricky concepts and revise them using our online MCQ tests.
Best Practices for Class 9 Mathematics Preparation
For the best results, solve one assignment for Chapter 12 Statistics on daily basis. Using a timer while practicing will further improve your problem-solving skills and prepare you for the actual CBSE exam.
FAQs
You can download free PDF assignments for Class 9 Mathematics Chapter 12 Statistics from StudiesToday.com. These practice sheets have been updated for the 2026-27 session covering all concepts from latest NCERT textbook.
Yes, our teachers have given solutions for all questions in the Class 9 Mathematics Chapter 12 Statistics assignments. This will help you to understand step-by-step methodology to get full marks in school tests and exams.
Yes. These assignments are designed as per the latest CBSE syllabus for 2026. We have included huge variety of question formats such as MCQs, Case-study based questions and important diagram-based problems found in Chapter 12 Statistics.
Practicing topicw wise assignments will help Class 9 students understand every sub-topic of Chapter 12 Statistics. Daily practice will improve speed, accuracy and answering competency-based questions.
Yes, all printable assignments for Class 9 Mathematics Chapter 12 Statistics are available for free download in mobile-friendly PDF format.