

ICSE Solutions Selina Concise Class 9 Mathematics Chapter 18 Statistics have been provided below and is also available in Pdf for free download. The Selina Concise ICSE solutions for Class 9 Mathematics have been prepared as per the latest syllabus and ICSE books and examination pattern suggested in Class 9. Questions given in ICSE Selina Concise book for Class 9 Mathematics are an important part of exams for Class 9 Mathematics and if answered properly can help you to get higher marks. Refer to more Chapter-wise answers for ICSE Class 9 Mathematics and also download more latest study material for all subjects. Chapter 18 Statistics is an important topic in Class 9, please refer to answers provided below to help you score better in exams
Selina Concise Chapter 18 Statistics Class 9 Mathematics ICSE Solutions
Class 9 Mathematics students should refer to the following ICSE questions with answers for Chapter 18 Statistics in Class 9. These ICSE Solutions with answers for Class 9 Mathematics will come in exams and help you to score good marks
Chapter 18 Statistics Selina Concise ICSE Solutions Class 9 Mathematics
Exercise 18(A)
Question 1. Identify whether each of the following variables is discrete or continuous:
(a) Number of children in a family
(b) Heights of students in a class
(c) Number of pages in a textbook
(d) Temperatures recorded daily in a city
(e) Number of cars in a parking lot
Answer:
(a) This is a discrete variable.
(b) This is a continuous variable.
(c) This is a discrete variable.
(d) This is a continuous variable.
(e) This is a discrete variable.
In simple words: A discrete variable can only be counted in whole numbers, while a continuous variable can have any fractional or decimal value within a range.
Exam Tip: Remember that countable quantities are discrete, whereas measurable attributes like height, weight, and temperature are continuous.
Question 2. Construct a frequency distribution table with tally marks for the given data using the class intervals 1-10, 11-20, 21-30, 31-40, and 41-50.
Answer:
The structured frequency distribution table is as follows:
| Marks | Tally Marks | Frequency |
|---|---|---|
| 1-10 | |||| | 4 |
| 11-20 | 8 | |
| 21-30 | 6 | |
| 31-40 | 6 | |
| 41-50 | 6 |
In simple words: Group the raw data into the specified intervals, count how many numbers fall into each interval using tally marks, and write the total count as the frequency.
Exam Tip: Make sure each tally group of five is drawn with four vertical lines and one diagonal line crossing through them to avoid counting mistakes.
Question 3. Form a continuous frequency distribution table for the given marks using the class intervals 0-10, 10-20, 20-30, 30-40, and 40-50. Explain where the values like 30 and 40 are included.
Answer:
The continuous frequency distribution table is shown below:
| Marks | Tally Marks | Frequency |
|---|---|---|
| 0-10 | |||| | 4 |
| 10-20 | 6 | |
| 20-30 | ||| | 3 |
| 30-40 | |||| | 4 |
| 40-50 | 7 |
In this continuous frequency distribution, a boundary value like 30 is placed in the class interval 30-40, not in the preceding interval 20-30. Similarly, a value of 40 is categorized under the class interval 40-50, and excluded from the 30-40 interval.
In simple words: When grouping numbers where the end of one group is the start of the next, the boundary number always goes into the higher group. For example, 30 belongs to 30-40, not 20-30.
Exam Tip: Under the exclusive method, the upper limit of an interval is not counted in that interval, but is counted as the lower limit of the next successive interval.
Question 4. Answer the following questions based on statistical terms and calculations:
(a) Define a quantity that can take different numerical values.
(b) What type of variables are those that can take only specific, distinct values?
(c) What type of variable is one that can assume any value within a given interval?
(d) Find the range of the data if the highest value is 25 and the lowest value is 6.
(e) State the lower and upper limits for the class interval 35-46.
(f) Calculate the class mark for the class interval 22-29.
Answer:
(a) It is defined as a variable.
(b) These are classified as discrete variables.
(c) This is classified as a continuous variable.
(d) Range = Maximum value - Minimum value = \( 25 - 6 = 19 \).
(e) The lower limit is 35 and the upper limit is 46.
(f) The class mark is calculated as: \( \frac{22 + 29}{2} = \frac{51}{2} = 25.5 \).
In simple words: The range is the difference between the largest and smallest numbers. The class mark is simply the average of the lowest and highest values of a group.
Exam Tip: Be sure to write the formula for class mark, which is \( \frac{\text{Lower limit} + \text{Upper limit}}{2} \), to secure full working marks in exams.
Question 5. For the class intervals 10-19, 20-29, 30-39, and 40-49, find the lower limit, upper limit, and class mark (midpoint) of each.
Answer:
The limits and midpoint calculations for each class interval are as follows:
- For the class interval 10-19: the lower limit is 10, the upper limit is 19, and the midpoint is \( \frac{10 + 19}{2} = 14.5 \).
- For the class interval 20-29: the lower limit is 20, the upper limit is 29, and the midpoint is \( \frac{20 + 29}{2} = 24.5 \).
- For the class interval 30-39: the lower limit is 30, the upper limit is 39, and the midpoint is \( \frac{30 + 39}{2} = 34.5 \).
- For the class interval 40-49: the lower limit is 40, the upper limit is 49, and the midpoint is \( \frac{40 + 49}{2} = 44.5 \).
In simple words: To find the middle value of any interval, add its lower number and its higher number together, then divide that sum by two.
Exam Tip: For inclusive intervals like 10-19, use the actual limits as written in the question to calculate the class mark directly.
Question 6. Find the lower limit, upper limit, and class mark for the following decimal class intervals: 1.1-2.0, 2.1-3.0, and 3.1-4.0.
Answer:
The limits and mid-values for the given intervals are calculated as follows:
- For the class interval 1.1-2.0: the lower limit is 1.1, the upper limit is 2.0, and the class mark is \( \frac{1.1 + 2.0}{2} = 1.55 \).
- For the class interval 2.1-3.0: the lower limit is 2.1, the upper limit is 3.0, and the class mark is \( \frac{2.1 + 3.0}{2} = 2.55 \).
- For the class interval 3.1-4.0: the lower limit is 3.1, the upper limit is 4.0, and the class mark is \( \frac{3.1 + 4.0}{2} = 3.55 \).
In simple words: Add the decimal limits together and divide by two to locate the exact center of each decimal group.
Exam Tip: Ensure your arithmetic is correct when adding decimals, particularly with carries, before dividing by 2.
Question 7. Based on a grouped frequency distribution with classes 30-34, 35-39, 40-44, 45-49, 50-54, and 55-59, answer the following:
(a) Find the actual class boundaries of the fourth class.
(b) Determine the class boundaries of the sixth class.
(c) Calculate the class mark of the third class.
(d) Write down the upper and lower limit of the fifth class.
(e) Calculate the class size of the third class.
Answer:
(a) The true boundaries for the fourth class (45-49) are 44.5-49.5.
(b) The actual class boundaries for the sixth class (55-59) are 54.5-59.5.
(c) The class mark of the third class (40-44) is the average of its boundaries: \( \frac{40 + 44}{2} = 42 \).
(d) For the fifth class (50-54), the upper limit is 54 and the lower limit is 50.
(e) The size of the third class is: \( 44 - 40 + 1 = 5 \).
In simple words: To find the real boundary limits when there are gaps between groups, subtract 0.5 from the start and add 0.5 to the end. The class size is the actual span of numbers inside the group.
Exam Tip: Class size for an inclusive interval is calculated as \( \text{Upper Limit} - \text{Lower Limit} + 1 \). Don't forget to add 1!
Question 8. Construct the cumulative frequency distribution tables for the following sets of data:
(i) Class intervals 0-8, 8-16, 16-24, 24-32, 32-40, 40-48 with frequencies 9, 13, 12, 7, 15, and 6 respectively.
(ii) Class intervals 1-10, 11-20, 21-30, 31-40, 41-50 with frequencies 12, 18, 23, 15, and 10 respectively.
Answer:
(i) The cumulative frequency distribution table is:
| C.I. | c.f. |
|---|---|
| 0-8 | 9 |
| 8-16 | 22 |
| 16-24 | 34 |
| 24-32 | 41 |
| 32-40 | 56 |
| 40-48 | 62 |
(ii) The cumulative frequency distribution table is:
| C.I. | c.f. |
|---|---|
| 1-10 | 12 |
| 11-20 | 30 |
| 21-30 | 53 |
| 31-40 | 68 |
| 41-50 | 78 |
In simple words: Cumulative frequency is found by adding up the frequencies as you go down. The first value is the first frequency, the second is the sum of the first two, and so on.
Exam Tip: The final cumulative frequency must equal the sum of all individual frequencies. Check this total to confirm your math is correct.
Question 9. Construct the frequency distribution tables for the following cumulative data:
(i) Intervals 10-19, 20-29, 30-39, 40-49 with respective frequencies 8, 11, 4, and 7.
(ii) Intervals 5-10, 10-15, 15-20, 20-25, 25-30 with respective frequencies 18, 12, 16, 27, and 17.
Answer:
(i) The frequency distribution table is:
| C.I. | Frequency |
|---|---|
| 10-19 | 8 |
| 20-29 | 11 |
| 30-39 | 4 |
| 40-49 | 7 |
(ii) The frequency distribution table is:
| C.I. | Frequency |
|---|---|
| 5-10 | 18 |
| 10-15 | 12 |
| 15-20 | 16 |
| 20-25 | 27 |
| 25-30 | 17 |
In simple words: This table maps each interval to its individual frequency count, showing how many entries fall within each range.Exam Tip: Be mindful of whether the intervals are inclusive or exclusive so you know how the data was grouped.
Question 10. Prepare a frequency distribution table for the following data groups: 0-10, 10-20, 20-30, 30-40, 40-50, and 50-60 with frequencies 6, 9, 15, 9, 14, and 17 respectively.
Answer:
Below is the prepared frequency table:
| C.I. | Frequency |
|---|---|
| 0-10 | 6 |
| 10-20 | 9 |
| 20-30 | 15 |
| 30-40 | 9 |
| 40-50 | 14 |
| 50-60 | 17 |
In simple words: This table pairs each ten-point interval with the number of times data occurred within that range.
Exam Tip: Keep your columns clean and clearly labeled with headers like C.I. (Class Interval) and Frequency.
Question 11. Based on the frequency table of student age groups, answer the questions below:
| C.I. | Frequency |
|---|---|
| 4-7 | 85 |
| 7-10 | 55 |
| 10-13 | 103 |
| 13-16 | 57 |
(i) What is the total number of students in the age group 10-13?
(ii) Which age group contains the least number of students?
Answer:
(i) Looking at the table, there are 103 students within the age group 10-13.
(ii) The class interval with the minimum frequency (55) is the 7-10 age group.
In simple words: Look up the numbers on the table to answer. The age group 10-13 has 103 kids, and the group with the fewest kids is 7-10, with only 55.
Exam Tip: Read the table row by row carefully to make sure you do not mix up frequencies with adjacent class intervals.
Question 12. Complete the missing values in the cumulative frequency table shown below:
| Class Interval | Frequency | Cumulative Frequency |
|---|---|---|
| 25-34 | __ | 15 |
| 35-44 | __ | 28 |
| 45-54 | 21 | __ |
| 55-64 | 16 | __ |
| 65-75 | __ | 73 |
| 75-84 | 12 | __ |
Answer:
By utilizing the relationship where the cumulative frequency of a class is the sum of its own frequency and the cumulative frequency of the preceding class, we can find the missing numbers:
1. For class 25-34: Frequency must equal the first cumulative frequency, which is 15.
2. For class 35-44: Frequency = \( 28 - 15 = 13 \).
3. For class 45-54: Cumulative Frequency = \( 28 + 21 = 49 \).
4. For class 55-64: Cumulative Frequency = \( 49 + 16 = 65 \).
5. For class 65-75: Frequency = \( 73 - 65 = 8 \).
6. For class 75-84: Cumulative Frequency = \( 73 + 12 = 85 \).
The completed table is:
| Class Interval | Frequency | Cumulative Frequency |
|---|---|---|
| 25-34 | 15 | 15 |
| 35-44 | 13 | 28 |
| 45-54 | 21 | 49 |
| 55-64 | 16 | 65 |
| 65-75 | 8 | 73 |
| 75-84 | 12 | 85 |
In simple words: To find a missing frequency, subtract the previous total from the current total. To find a missing total, add the current group's frequency to the previous total.
Exam Tip: Work step-by-step from top to bottom. Double-check your final total (85) by adding up the entire completed frequency column.
Question 13. For the given frequency table of digit occurrences, identify:
| Digit (X) | 0 | 1 | 2 | 3 | 4 | 5 | 6 | 7 | 8 | 9 |
|---|---|---|---|---|---|---|---|---|---|---|
| Frequency (F) | 2 | 5 | 5 | 8 | 4 | 5 | 4 | 4 | 5 | 8 |
(i) The most frequently occurring digits.
(ii) The least frequently occurring digit.
Answer:
(i) The highest frequency is 8, which corresponds to the digits 3 and 9.
(ii) The lowest frequency is 2, which corresponds to the digit 0.
In simple words: The digits that show up the most are 3 and 9 (8 times each). The digit that shows up the least is 0 (only 2 times).
Exam Tip: Don't write the frequency value as the answer itself; the question asks for the "digits" (X values), not their counts (F values).
Exercise 18(B)
Question 1. Construct a histogram and the corresponding frequency polygon for the following grouped data:
| Class Interval | 0-4 | 4-8 | 8-12 | 12-16 | 16-20 | 20-24 |
|---|---|---|---|---|---|---|
| Frequency | 4 | 7 | 10 | 15 | 11 | 6 |
Answer:
Follow these steps to construct the frequency polygon:
1. Draw a histogram using the given class intervals on the horizontal axis and frequencies on the vertical axis.
2. Mark the midpoint of the top horizontal side of each rectangular bar.
3. Mark the midpoints of the adjacent preceding class interval (-4 to 0) and the next succeeding class interval (24-28) on the horizontal axis where frequency is zero.
4. Connect these consecutive midpoints using straight line segments to complete the frequency polygon.
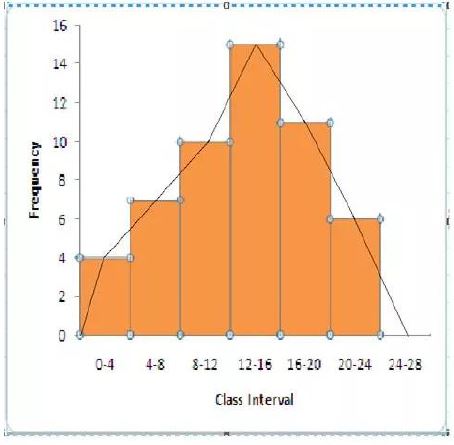
In simple words: First draw the bars of the histogram. Then, connect the exact middle point at the top of each bar with straight lines. Don't forget to tie down the ends of the line to the ground at the empty class intervals on the left and right.
Exam Tip: Remember to always anchor the ends of your frequency polygon to the horizontal axis by extending it to the midpoints of the preceding and succeeding empty classes.
Question 2. Construct a combined histogram and frequency polygon for the following class intervals and frequencies: 10-20 (frequency 3), 20-30 (frequency 5), 30-40 (frequency 6), 40-50 (frequency 4), and 50-60 (frequency 2).
Answer:
Follow these steps to construct the required combined histogram and frequency polygon:
1. Create a histogram based on the intervals 10-20, 20-30, 30-40, 40-50, and 50-60 with their respective frequencies.
2. Locate and mark the midpoint at the upper horizontal edge of each bar.
3. Mark the midpoints of the immediately lower class (0-10) and higher class (60-70) on the horizontal axis.
4. Link these marked midpoints in order using straight line segments.
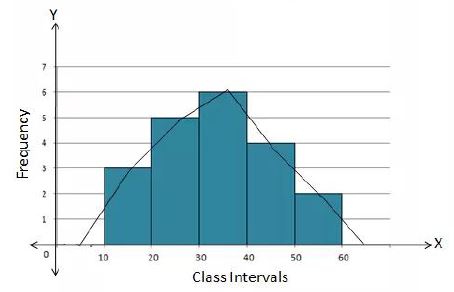
In simple words: Draw bars for each group on your graph. Put points at the center of the top of each bar, plus two extra points on the zero line at the start and end, then connect them with straight lines.
Exam Tip: Be precise when plotting coordinates on graph paper. A minor shift in midpoints can result in a deduction of marks.
Question 3. Draw a frequency polygon for the following inclusive class intervals by first converting them into exclusive form: 10-14 (frequency 5), 15-19 (frequency 8), 20-24 (frequency 12), 25-29 (frequency 9), and 30-34 (frequency 4).
Answer:
First, we convert the discontinuous inclusive class intervals into continuous exclusive intervals by subtracting 0.5 from each lower limit and adding 0.5 to each upper limit. The converted frequency distribution table is:
| Class-Interval | Frequency |
|---|---|
| 9.5 - 14.5 | 5 |
| 14.5 - 19.5 | 8 |
| 19.5 - 24.5 | 12 |
| 24.5 - 29.5 | 9 |
| 29.5 - 34.5 | 4 |
Now, we draw the histogram and construct the frequency polygon using these adjusted intervals:
In simple words: When there is a gap between groups (like 14 and 15), adjust them by subtracting 0.5 and adding 0.5. Then, plot the bars and join their center points as usual.
Exam Tip: Histograms require continuous classes. Always check if intervals are continuous first; if not, convert them into exclusive form before plotting.
Question 4. Draw a histogram and frequency polygon for the daily wages of workers as given below: 125-175 (frequency 5), 175-225 (frequency 20), 225-275 (frequency 22), 275-325 (frequency 10), and 325-375 (frequency 6).
Answer:
We use the daily wages on the horizontal axis and the number of workers on the vertical axis to plot the histogram and the frequency polygon. Since the first class starts at 125, we draw a kink (broken line) near the origin on the horizontal axis.
In simple words: Draw a jagged kink on the bottom line because we start counting from 125 instead of 0. Draw the bars, put points on their top-centers, and link them together.
Exam Tip: Remember to include a kink (squiggly line) on the X-axis if your first interval starts at a value far from zero, as it shows the scale is broken.
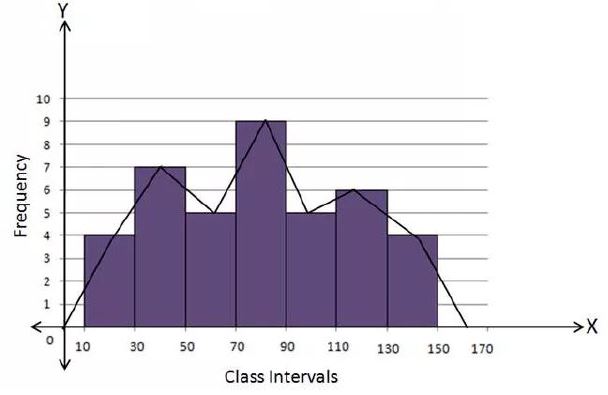
Question 5(i). Draw a frequency polygon for the following frequency distribution: (a) using a histogram, (b) without using a histogram: Class intervals 10-30, 30-50, 50-70, 70-90, 90-110, 110-130, 130-150 with frequencies 4, 7, 5, 9, 5, 6, 4 respectively.
Answer:
(a) **Using a Histogram:**
Create a histogram first and then join the top midpoints of each bar. Also link the polygon ends to the midpoints of the adjoining empty groups on both sides (-10 to 10 and 150 to 170).
(b) **Without using a Histogram:**
Find the class mark (midpoint) of each interval using \( \frac{\text{Upper Limit} + \text{Lower Limit}}{2} \) as shown below:
| C.I. | Class-mark | f |
|---|---|---|
| -10 - 10 | 0 | 0 |
| 10 - 30 | 20 | 4 |
| 30 - 50 | 40 | 7 |
| 50 - 70 | 60 | 5 |
| 70 - 90 | 80 | 9 |
| 90 - 110 | 100 | 5 |
| 110 - 130 | 120 | 6 |
| 130 - 150 | 140 | 4 |
| 150 - 170 | 160 | 0 |
Plot these class marks on the X-axis and their corresponding frequencies on the Y-axis. Join the plotted points sequentially:
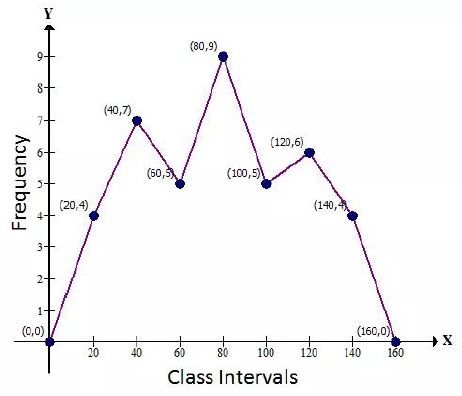
In simple words: (a) Build the bar graph first, then connect the peaks. (b) Find the middle of each group, plot those points as coordinates with their heights, and draw lines between them without any bars.
Exam Tip: If drawing a polygon without a histogram, create a helper table with class marks as coordinates (class-mark, frequency) to avoid mistakes while plotting points.
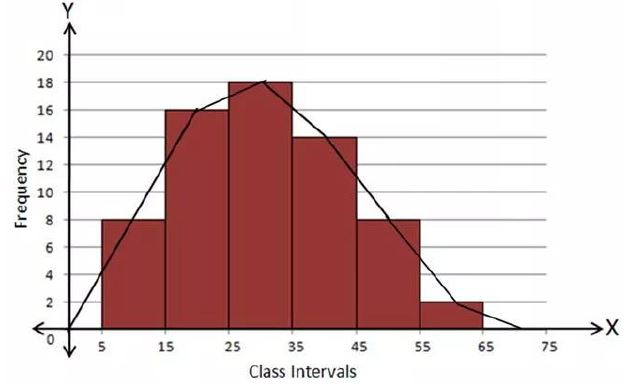
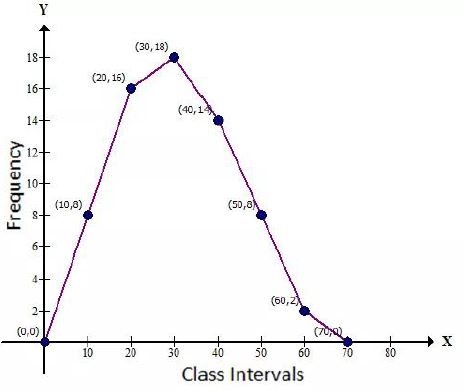
Question 5(ii). Draw a frequency polygon for the following distribution: (a) using a histogram, (b) without using a histogram: Class intervals 5-15, 15-25, 25-35, 35-45, 45-55, 55-65 with frequencies 8, 16, 18, 14, 8, 2 respectively.
Answer:
(a) **Using a Histogram:**
First draw the bars of the histogram for the intervals. Then, locate the midpoints of the tops of the bars and connect them. Extend the polygon to the zero frequency midpoints of empty class intervals on either side (-5 to 5 and 65 to 75).
b) **Without using a Histogram:**
Calculate the midpoints (class marks) first:
| C.I. | Class-mark | f |
|---|---|---|
| -5 - 5 | 0 | 0 |
| 5 - 15 | 10 | 8 |
| 15 - 25 | 20 | 16 |
| 25 - 35 | 30 | 18 |
| 35 - 45 | 40 | 14 |
| 45 - 55 | 50 | 8 |
| 55 - 65 | 60 | 2 |
| 65 - 75 | 70 | 0 |
Plot the coordinates (Class-mark, Frequency) and link them directly with straight line segments:
In simple words: (a) Build the bar graph first, then connect the peaks. (b) Find the middle of each group, plot those points as coordinates with their heights, and draw lines between them without any bars.
Exam Tip: Label all key coordinates, such as (10, 8) and (20, 16), on your hand-drawn frequency polygon to make the graph highly readable and professional.
ICSE Selina Concise Solutions Class 9 Mathematics Chapter 18 Statistics
Students can now access the detailed Selina Concise Solutions for Chapter 18 Statistics on our portal. These solutions have been carefully prepared as per latest ICSE Class 9 syllabus. Each solution given above has been updated based on the current year pattern to ensure Class 9 students have the most updated Mathematics content.
Master Selina Concise Textbook Questions
Our subject experts have provided detailed explanations for all the questions found in the Selina Concise textbook for Class 9 Mathematics. We have focussed on making the concepts easy for you in Chapter 18 Statistics so that students can understand the concepts behind every answer. For all numerical problems and theoretical concepts these solutions will help in strengthening your analytical skill required for the ICSE examinations.
Complete Mathematics Exam Preparation
By using these Selina Concise Class 9 solutions, you can enhance your learning and identify areas that need more attention. We recommend solving the Mathematics Questions from the textbook first and then use our teacher-verified answers. For a proper revision of Chapter 18 Statistics, students should also also check our Revision Notes and Sample Papers available on studiestoday.com.
FAQs
You can download the verified Selina Concise solutions for Chapter 18 Statistics on StudiesToday.com. Our teachers have prepared answers for Class 9 Mathematics as per 2026-27 ICSE academic session.
Yes, our solutions for Chapter 18 Statistics are designed as per new 2026 ICSE standards. 40% competency-based questions required for Class 9, are included to help students understand application-based logic behind every Mathematics answer.
Yes, every exercise in Chapter 18 Statistics from the Selina Concise textbook has been solved step-by-step. Class 9 students will learn Mathematics conceots before their ICSE exams.
Yes, follow structured format of these Selina Concise solutions for Chapter 18 Statistics to get full 20% internal assessment marks and use Class 9 Mathematics projects and viva preparation as per ICSE 2026 guidelines.