
Get the most accurate NCERT Solutions for Class 6 Mathematics Chapter 9 Data Handling here. Updated for the 2026-27 academic session, these solutions are based on the latest NCERT textbooks for Class 6 Mathematics. Our expert-created answers for Class 6 Mathematics are available for free download in PDF format.
Detailed Chapter 9 Data Handling NCERT Solutions for Class 6 Mathematics
For Class 6 students, solving NCERT textbook questions is the most effective way to build a strong conceptual foundation. Our Class 6 Mathematics solutions follow a detailed, step-by-step approach to ensure you understand the logic behind every answer. Practicing these Chapter 9 Data Handling solutions will improve your exam performance.
Class 6 Mathematics Chapter 9 Data Handling NCERT Solutions PDF
Data Handing
Exercise: 9.1
Q.1) In a Mathematics test, the following marks were obtained by 40 students. Arrange these marks in a table using tally marks.
8 1 3 7 6 5 5 4 4 2
4 9 5 3 7 1 6 5 2 7
7 3 8 4 2 8 9 5 8 6
7 4 5 6 9 6 4 4 6 6
(a) Find how many students obtained marks equal to or more than 7.
(b) How many students obtained marks below 4?
Sol.1) The fifth mark in a group of five marks should be used as a cross, as shown by ‘||||’.
These are tally marks. Thus, |||| || shows the count to be five plus two (i.e. seven)
and |||| |||| shows five plus five (i.e. ten).
The table using tally marks is as follows:
Marks Tally Marks Number of students
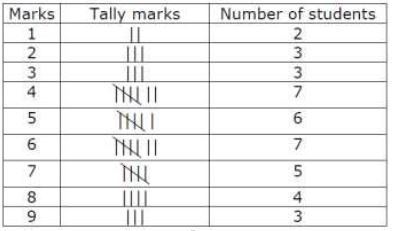
a) There are 5 students who obtained 7, 4 students who obtained 8 and 3 who obtained 9.
So, there are 5 + 4 + 3 = 12 students who obtained marks equal to or more than 7.
b) There are 2 students who obtained 1 mark, 3 obtained 2 marks and 3 obtained 3 marks.
So, there are 2 + 3 + 3 = 8 students who obtained marks below 4.
Q.2) Following is the choice of sweets of 30 students of Class VI.
Ladoo, Barfi, Ladoo, Jalebi, Ladoo, Rasgulla, Jalebi, Ladoo, Barfi, Rasgulla, Ladoo, Jalebi, Jalebi, Rasgulla, Ladoo, Rasgulla, Jalebi, Ladoo, Rasgulla, Ladoo, Ladoo, Barfi, Rasgulla, Rasgulla, Jalebi, Rasgulla, Ladoo, Rasgulla, Jalebi, Ladoo.
(a) Arrange the names of sweets in a table using tally marks.
(b) Which sweet is preferred by most of the students?
Sol.2)
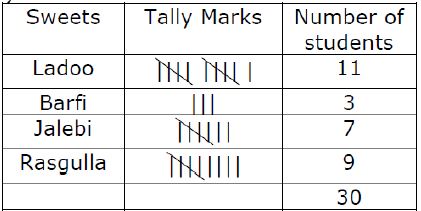
b) Ladoo is preferred by most of the students as the table shows the maximum number for ladoos.
Q.3) Catherine threw a dice 40 times and noted the number appearing each time as shown below:
1 3 5 6 6 3 5 4 1 6 2 5 3 4 6 1 5 5 6 1 1 2 2 3 5 2 4 5 5 6 5 1 6 2 3 5 2 4 1 5
Make a table and enter the data using tally marks. Find the number that appeared.
(a) The minimum number of times
(b) The maximum number of times
(c) Find those numbers that appear an equal number of times.
Sol.3)
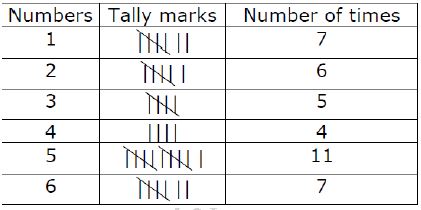
a) From the table, the number 4 has appeared only 4 times, and hence is the number that appeared minimum number of times.
b) The maximum number of times a number has appeared is 11. Hence 5 appeared the maximum number of times.
c) 1 and 6 have appeared equal number of times, that is, 7 times.
Q.4) Following pictograph shows the number of tractors in five villages.
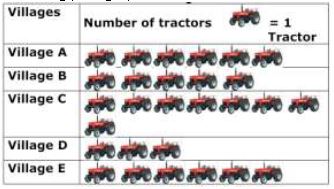
Observe the pictograph and answer the following questions.
(i) Which village has the minimum number of tractors?
(ii) Which village has the maximum number of tractors?
(iii) How many more tractors village C has as compared to village B.
(iv) What is the total number of tractors in all the five villages?
Sol.4) a) There are 3 tractor pictures for Village D which is less than the number of tractors for all the other villages. So, Village D has the minimum number of tractors.
b) There are 8 tractor pictures for Village C which is more than the number of tractors for all the other villages. So, Village C has the maximum number of tractors.
c) Village B has 5 tractors and village C has 8 tractors. So, there are 8 – 5 = 3 tractors more in village C than in village B.
d) There are 6 + 5 + 8 + 3 + 6 = 28 tractor pictures in all, which shows the total number
of tractors in all the five villages.
Q.5) The number of girl students in each class of a co-educational middle school is depicted by the pictograph:
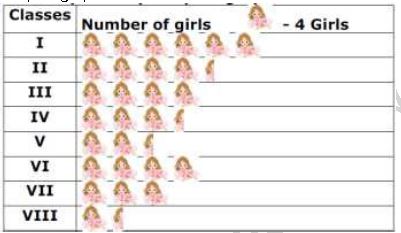
Observe this pictograph and answer the following questions:
(a) Which class has the minimum number of girl students?
(b) Is the number of girls in Class VI less than the number of girls in Class V?
(c) How many girls are there in Class VII?
Sol.5) a) There are lesser number of pictures in class VIII when compared to all other classes. So, class VIII has the minimum number of girl students.
b) We see that there are 4 pictures for class VI. As we see that 4 girls from the pictograph, there are 4 × 4 = 16 girls in class VI. There are 2 pictures representing 8 girls and a half picture representing 2 girls. So, there are 10 girls in class V. Class VI has 16 – 10 = 6 girls more than class V.
c) There are 3 pictures representing 3 × 4 = 12 students in class VII.
Q.6) The sale of electric bulbs on different days of a week is shown below:
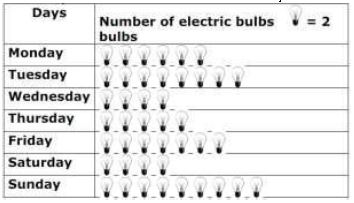
What can we conclude from the said pictograph?
Sol.6) a) Each picture of a bulb represents 2 bulbs according to the pictograph. So, 12 bulbs were sold on Monday, 16 bulbs were sold on Tuesday, 8 bulbs on Wednesday, 10 bulbs on
Thursday, 14 bulbs on Friday, 8 bulbs on Saturday and 18 bulbs on Sunday.
b) Maximum number of bulbs were sold on Sunday.
c) Same number of bulbs were sold on Wednesday and Saturday and it is the minimum number of bulbs.
d) Total bulbs sold in a week is 12 + 16 + 8 + 10 + 14 + 8 + 18 = 86 bulbs.
Q.7) In a village six fruit merchants sold the following number of fruit baskets in a particular season:
Observe this pictograph and answer the following questions :
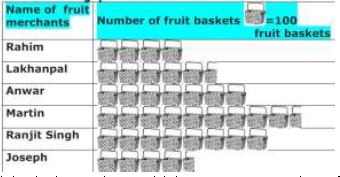
(a) Which merchant sold the maximum number of baskets?
(b) How many fruit baskets were sold by Anwar?
(c) The merchants who have sold 600 or more number of baskets are planning to buy a godown for the next season. Can you name them?
Sol.7) a) Each basket in the pictograph represents 100 baskets. There are more number of basket pictures for Martin, which shows that he sold the maximum number i.e., 950.
b) There are 7 basket images for Anwar in the graph. So, he sold 7 × 100 = 700 baskets.
c) Anwar has sold 700 baskets, Martin sold 900 + 50 = 950 baskets and Ranjit Singh sold 800 baskets. So, Anwar, Martin and Ranjit Singh sold more than 600 baskets.
Therefore, they are planning to buy a godown.
Exercise : 9.2
Q.1) Total number of animals in five villages are as follows:
Village A: 80 Village B: 120 Village C: 90
Village D: 40 Village E: 60
Prepare a pictograph of these animals using one symbol ⊗ to represent 10 animals and answer the following questions :
(a) How many symbols represent animals of village E?
(b) Which village has the maximum number of animals?
(c) Which village has more animals: village A or village C?
Sol.1) Pictograph is as follows:
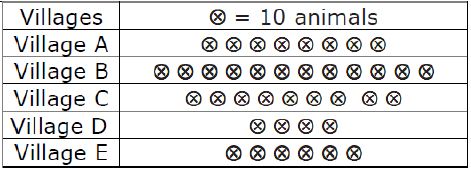
a) 6 symbols represent animals of village E.
b) From the pictograph, we see that there is more number of symbols for Village B and hence, it has the maximum number of animals.
c) There are 8 symbols in village A which shows that there are 80 animals in village A and there are 9 symbols in village B, which shows that there are 90 animals in village C.
So, village C has more number of animals than village A.
Q.2) Total number of students of a school in different years is shown in the following table:
Year No. of students
1996 400
1998 535
2000 472
2002 600
2004 623
A. Prepare a pictograph of students using one symbol to represent 100 students and
answer the following questions:
(a) How many symbols represent total number of students in the year 2002?
(b) How many symbols represent total number of students for the year 1998?
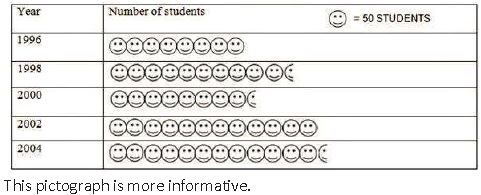
B. Prepare another pictograph of students using any other symbol each representing
50 students. Which pictograph do you find more informative?
Sol.2) The pictograph looks as follows:
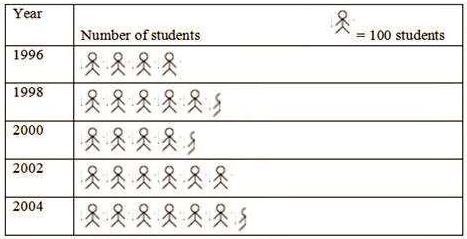
a) 6 symbols represent total number of students in the year 2002
b) 5 complete symbols and 1 incomplete symbol.
B. The pictograph of students looks as follows:
Exercise: 9.3
Q.1) The bar graph given below shows the amount of wheat purchased by government during the year 1998-2002. Read the bar graph and write down your observations.
In which year was
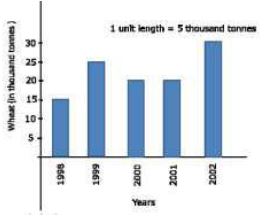
(a) the wheat production maximum?
(b) the wheat production minimum?
Sol.1) a) The maximum wheat production is shown by the longest bar, which is for the year 2002.
b) The minimum wheat production is shown by the smallest bar and is for the year 1998.
Q.2) Observe this bar graph which is showing the sale of shirts in a ready-made shop from Monday to Saturday.
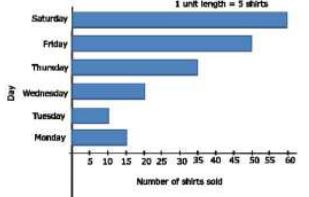
Now answer the following questions:
(a) What information does the above bar graph give?
(b) What is the scale chosen on the horizontal line representing number of shirts?
(c) On which day was the maximum number of shirts sold? How many shirts were sold on that day?
(d) On which day was the minimum number of shirts sold?
(e) How many shirts were sold on Thursday?
Sol.2) a) The bar graph represents the number of shirts sold from Monday to Saturday.
b) 1 unit = 5 shirts
c) The maximum number of shirts sold on a particular day is represented by the longest bar, which is on Saturday. From the graph, we see that 60 shirts were sold on Saturday.
d) The minimum number of shirts sold on a particular day is represented by the shortest bar, which is on Tuesday.
e) 35 shirts were sold on Thursday.
Q.3) Observe this bar graph which shows the marks obtained by Aziz in half-yearly examination in different subjects. Answer the given questions.
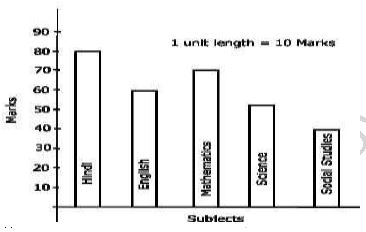
(a) What information does the bar graph give?
(b) Name the subject in which Aziz scored maximum marks.
(c) Name the subject in which he has scored minimum marks.
(d) State the name of the subjects and marks obtained in each of them.
Sol.3) a) The graph shows the marks obtained by Aziz in various subjects.
b) Aziz scored maximum marks in Hindi as it is represented by the longest bar in the graph.
c) He scored minimum marks in Social studies, which is represented by the smallest bar in the graph.
d) Hindi – 80 marks
English – 60 marks
Mathematics – 70 marks
Science – 50 marks
Social studies – 40 marks
Exercise 9.4
Q.1) A survey of 120 school students was done to find which activity they prefer to do in their free time.
Preferred activity No. of students
Playing 45
Reading story books 30
Watching TV 20
Listening to music 10
Painting 15
Draw a bar graph to illustrate the above data taking scale of 1 unit length = 5 students.
Which activity is preferred by most of the students other than playing?
Sol.1)
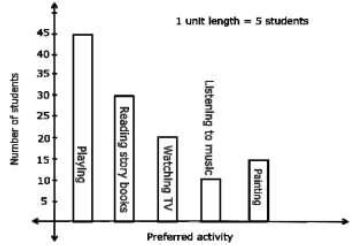
Other than playing, the activity that is preferred most is Reading story books.
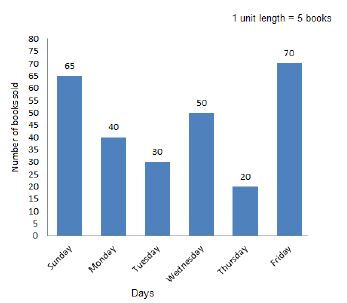
Q.2) The number of Mathematics books sold by a shopkeeper on six consecutive days is shown below:
Days No. of books sold
Sunday 65
Monday 40
Tuesday 30
Wednesday 50
Thursday 20
Friday 70
Draw a bar graph to represent the above information choosing the scale of your choice.
Sol.2) The bar graph with scale 1 unit length = 5 books is as shown below.
Q.3) Following table shows the number of bicycles manufactured in a factory during the years 1998 to 2002. Illustrate this data using a bar graph. Choose a scale of your choice.
Years No. of bicycles manufactured
1998 800
1999 600
2000 900
2001 1100
2002 1200
(a) In which year was the maximum number of bicycles manufactured?
(b) In which year was the minimum number of bicycles manufactured?
Sol.3) The graph below shows the number of bicycles manufactured in a factory during 1998 to 2002.
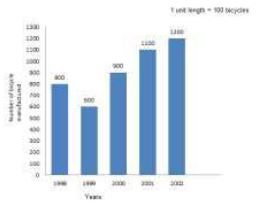
a) Maximum number of bicycles was manufactured in the year 2002.
b) Minimum number of bicycles was manufactured in the year 1999.
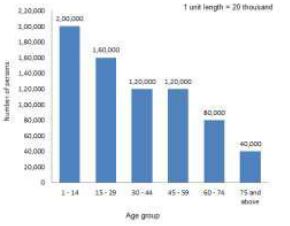
Q.4) Number of persons in various age groups in a town is given in the following table.
Age group No. of persons
1 – 14 2 lakhs 1 – 14 2 lakhs
15 – 29 1 lakh 60 thousands 15 – 29 1 lakh 60 thousands
30 - 44 1 lakh 20 thousands 30 - 44 1 lakh 20 thousands
45 – 59 1 lakh 20 thousands 45 – 59 1 lakh 20 thousands
60 – 74 80 thousands 60 – 74 80 thousands
75 and above 40 thousands 75 and above 40 thousands
Draw a bar graph to represent the above information and answer the following questions.
(take 1 unit length = 20 thousands)
(a) Which two age groups have same population?
(b) All persons in the age group of 60 and above are called senior citizens. How many senior citizens are there in the town?
Sol.4) a) Age groups 30 – 44 and 45 – 59
b) All persons in the age group of 60 and above are called senior citizens. There are 80,000 people in the age group 60 – 74 and 40,000 in the age group 75 and above. So totally, there are 80,000 + 40,000 = 1,20,000 senior citizens in the town.
Question. The question is related to the information seen on the wrapper of Healthy Soya Nuts.
What would be Mr. Subramaniam's fat intake in consuming 100 g of Healthy Soya Nuts?
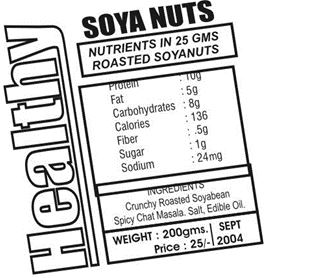
(a) 5 g
(b) 10 g
(c) 20 g
(d) 125 g
Answer : C
Question. The question is related to the information seen on the wrapper of Healthy Soya Nuts.
Mrs. Subramaniam has been advised by her doctor to limit her protein intake to about 45 g a day. If she had already consumed 25 g of protein in her food that day, at most how many grams of Healthy Soya Nuts could she safely eat?
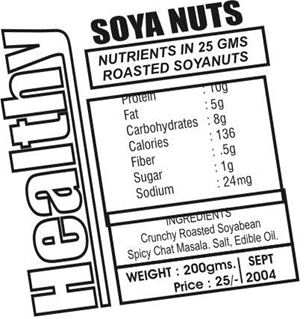
(a) About 50 g
(b) About 25 g
(c) About 20 g
(d) About 10 g
Answer : A
Question. The graph below shows the number of steps 4 girls from class 6-B take to reach their classroom from the main gate. The question is based on this graph.
How many steps more than Pinky did Bobby take to reach the classroom?
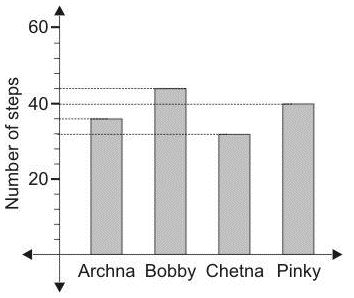
(a) 1
(b) 2
(c) 4
(d) 10
Answer : C
Question. The graph below shows the number of steps 4 girls from class 6-B take to reach their classroom from the main gate. The question is based on this graph.
Assuming taller people have longer steps, who is the tallest?
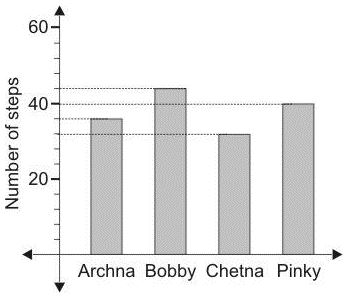
(a) Archana
(b) Bobby
(c) Chetna
(d) Pinky
Answer : C
Question. The bar graph here shows the number of vehicles parked in a parking area on a particular day. Answer the question based on this bar graph
In all, how many vehicles were parked in the area?
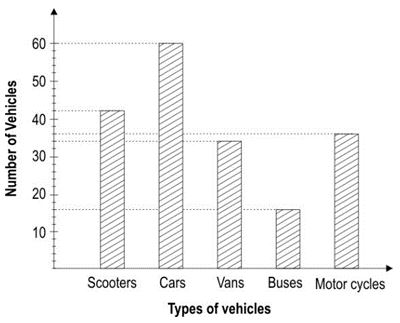
(a) 42
(b) 60
(c) 179
(d) 188
Answer : D
Question. The bar graph here shows the number of vehicles parked in a parking area on a particular day. Answer the question based on this bar graph
How many more two-wheelers were parked in the area than cars?
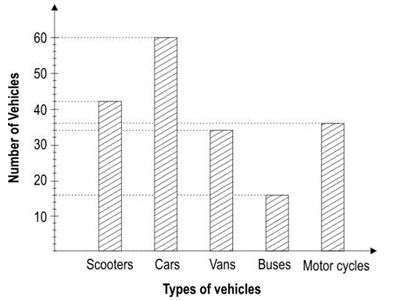
(a) 11
(b) 12
(c) 18
(d) 19
Answer : C
Question. Manju collected used bottle caps for a school project. The different coloured caps collected by her is shown in this pictograph.
If the total number of caps collected by Manju is 96, how many caps
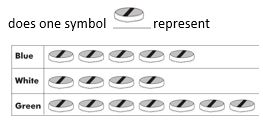
(a) 5
(b) 6
(c) 9
(d) 10
Answer : B
Question. Manju collected used bottle caps for a school project. The different coloured caps collected by her is shown in this pictograph.
The total number of caps collected by Manju is 96. Manju wants twice as many green caps as the number of blue caps that she has now. How many more green caps does Manju need?
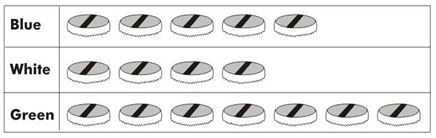
(a) 18
(b) 12
(c) 6
(d) 3
Answer : A
Question. A teacher awards points to the students in her class for their work. A chart is maintained in the class to mark the points given or taken away from each student. Shown below is a part of the chart for a certain week. See it and answer the question. The symbol √ means 10 points given for work that is well done.
The symbol X means 5 points taken away for badly done work.
On which day of the week did just one child out of the four lose points?
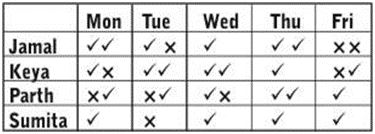
(a) Monday
(b) Tuesday
(c) Wednesday
(d) Thursday
Answer : C
Question. A teacher awards points to the students in her class for their work. A chart is maintained in the class to mark the points given or taken away from each student. Shown below is a part of the chart for a certain week. See it and answer the question. The symbol √ means 10 points given for work that is well done.
The symbol X means 5 points taken away for badly done work.
What was Keya's score for the week?
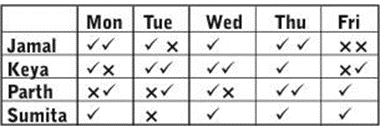
(a) 50
(b) 80
(c) 70
(d) 90
Answer : B
Question. Which TABLE should you look up to find the details of the Orissa Sampark Kranti train?
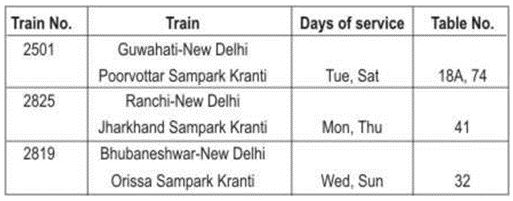
(a) 18A,74
(b) 2819
(c) 41
(d) 32
Answer : D
Question. Mrs. Bora wants to travel from Guwahati to New Delhi in the second week of January. On which dates can she start from Guwahati if she travels by Poorvottar Sampark Kranti?
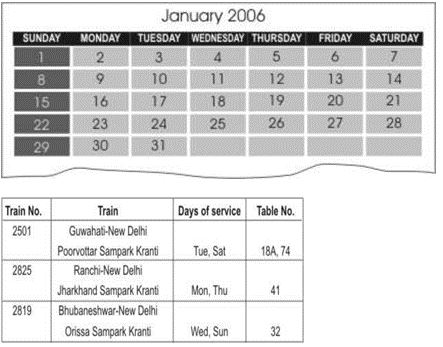
(a) 9th or 12th
(b) 8th or 11th
(c) 10th or 14th
(d) 3th or 7th
Answer : C
Question. The graph below shows the number of books borrowed from a children’s library from July 1 to December 31. Study it and answer the question. Which of the following CAN be found out from this graph?
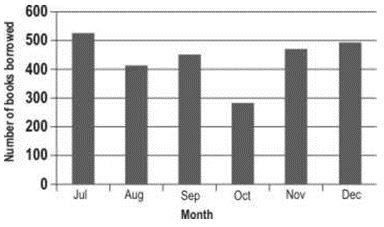
(a) Number of books borrowed between 15 and 30 November
(b) Why such few books were borrowed in October
(c) The number of children who visited the library in August
(d) The months during the period in which more than 500 books were borrowed.
Answer : D
Question. The graph below shows the number of books borrowed from a children’s library from July 1 to December 31. Study it and answer the question.
In which month did the number of books borrowed INCREASE the most compared to the month before?
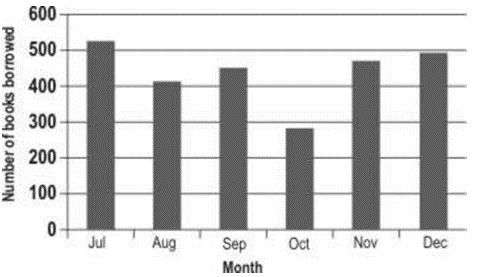
(a) July
(b) September
(c) November
(d) December
Answer : C
Question. The table below gives some data about the sunrise and sunset timings in a city on 3 days in the month of May According to the 12-hour clock, at what time does the sun set on 23rd May?
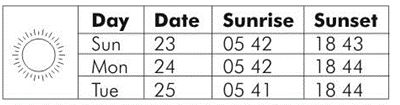
(a) 8:43 P.M
(b) 5:42 A.M
(c) 6:43 A.M
(d) 6:43 P.M
Answer : D
Look at the bar graph showing the ages of four children. Which table matches the values shown in the bar graph?
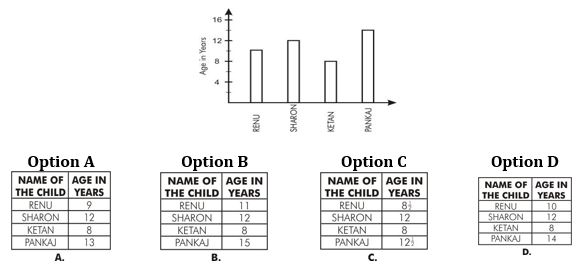
Answer : D
Question. The programme schedule for CNN channel from morning to night for a particular day is given. The question is based on this schedule.
Sourav was away for a cricket match from noon to 4 p.m that day but still managed to watch his favourite programme World Sport from start to finish. At what time did he start watching the programme?
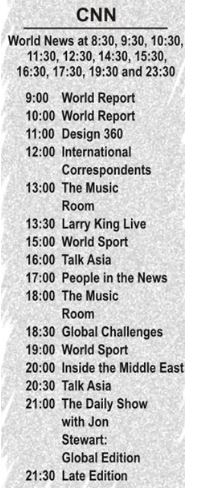
(a) 9 AM
(b) 3 PM
(c) 7 PM
(d) 9 PM
Answer : C
Question. The programme schedule for CNN channel from morning to night for a particular day is given. The question is based on this schedule.
Sourav's father watched CNN channel for 1½ hours at a stretch starting from 9 p.m that day. Which programmes did he watch?
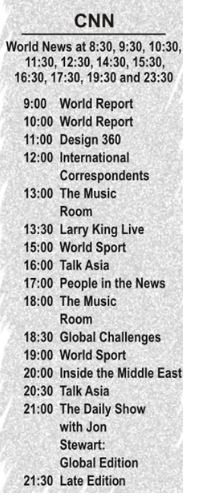
(a) World Sport, Inside the Middle East, Talk Asia
(b) World Sport, World News, Inside the Middle East.
(c) World Report, World News
(d) The Daily Show with Jon Stewart: Global Edition, Late Edition
Answer : D
Free study material for Mathematics
NCERT Solutions Class 6 Mathematics Chapter 9 Data Handling
Students can now access the NCERT Solutions for Chapter 9 Data Handling prepared by teachers on our website. These solutions cover all questions in exercise in your Class 6 Mathematics textbook. Each answer is updated based on the current academic session as per the latest NCERT syllabus.
Detailed Explanations for Chapter 9 Data Handling
Our expert teachers have provided step-by-step explanations for all the difficult questions in the Class 6 Mathematics chapter. Along with the final answers, we have also explained the concept behind it to help you build stronger understanding of each topic. This will be really helpful for Class 6 students who want to understand both theoretical and practical questions. By studying these NCERT Questions and Answers your basic concepts will improve a lot.
Benefits of using Mathematics Class 6 Solved Papers
Using our Mathematics solutions regularly students will be able to improve their logical thinking and problem-solving speed. These Class 6 solutions are a guide for self-study and homework assistance. Along with the chapter-wise solutions, you should also refer to our Revision Notes and Sample Papers for Chapter 9 Data Handling to get a complete preparation experience.
FAQs
The complete and updated is available for free on StudiesToday.com. These solutions for Class 6 Mathematics are as per latest NCERT curriculum.
Yes, our experts have revised the as per 2026 exam pattern. All textbook exercises have been solved and have added explanation about how the Mathematics concepts are applied in case-study and assertion-reasoning questions.
Toppers recommend using NCERT language because NCERT marking schemes are strictly based on textbook definitions. Our will help students to get full marks in the theory paper.
Yes, we provide bilingual support for Class 6 Mathematics. You can access in both English and Hindi medium.
Yes, you can download the entire in printable PDF format for offline study on any device.