

ICSE Solutions Selina Concise Class 7 Mathematics Chapter 21 Data Handling have been provided below and is also available in Pdf for free download. The Selina Concise ICSE solutions for Class 7 Mathematics have been prepared as per the latest syllabus and ICSE books and examination pattern suggested in Class 7. Questions given in ICSE Selina Concise book for Class 7 Mathematics are an important part of exams for Class 7 Mathematics and if answered properly can help you to get higher marks. Refer to more Chapter-wise answers for ICSE Class 7 Mathematics and also download more latest study material for all subjects. Chapter 21 Data Handling is an important topic in Class 7, please refer to answers provided below to help you score better in exams
Selina Concise Chapter 21 Data Handling Class 7 Mathematics ICSE Solutions
Class 7 Mathematics students should refer to the following ICSE questions with answers for Chapter 21 Data Handling in Class 7. These ICSE Solutions with answers for Class 7 Mathematics will come in exams and help you to score good marks
Chapter 21 Data Handling Selina Concise ICSE Solutions Class 7 Mathematics
Exercise 21(A)
Question 1. Consider the following numbers :
68, 76, 63, 75, 93, 83, 70, 115, 82, 105, 90, 103, 92, 52, 99, 73, 75, 63, 77 and 71.
(i) Arrange these numbers in ascending order.
(ii) What the range of these numbers?
Answer:
(i) Arranging the given numbers from smallest to largest, we get:
52, 63, 63, 68, 70, 71, 73, 75, 75, 76, 77, 82, 83, 90, 92, 93, 99, 103, 105, 115
(ii) To find the range, subtract the smallest number from the largest number:
Range = Largest value \( - \) Smallest value
Range = \( 115 - 52 = 63 \)
In simple words: First, list the numbers from smallest to largest. To find the range, find the gap between the biggest and smallest numbers by subtracting them.
Exam Tip: Be careful when counting repeated numbers like 63 and 75; ensure every data point from the question is included in your ordered list.
Question 2. Represent the following data in the form of a frequency distribution table :
16, 17, 21, 20, 16, 20, 16, 18, 17, 21, 17, 18, 19, 17, 15, 15, 19, 19, 18, 17, 17, 15, 15, 16, 17, 17, 19, 18, 17, 16, 15, 20, 16, 17, 19, 18, 19, 16, 21 and 17.
Answer:
By counting how often each number appears, we can build the frequency distribution table as follows:
| Numbers | Tally Marks | Frequency |
|---|---|---|
| 15 | 5 | |
| 16 | 7 | |
| 17 | 11 | |
| 18 | 5 | |
| 19 | 6 | |
| 20 | ||| | 3 |
| 21 | ||| | 3 |
| Total | 40 |
In simple words: A frequency table shows how many times each number is found in the list. Tally marks are drawn in groups of five to help us count easily.
Exam Tip: Always sum the frequency column at the end to ensure the total matches the total count of numbers given in the question.
Question 3. A die was thrown 20 times and following scores were recorded.
2, 1, 5, 2, 4, 3, 6, 1, 4, 2, 5, 1, 6, 2, 6, 3, 5, 4, 1 and 3.
Prepare a frequency table for the scores.
Answer:
We can count the occurrences of each face of the die to create this frequency table:
| No. of Thrown Dies | Tally Marks | Frequency |
|---|---|---|
| 1 | |||| | 4 |
| 2 | |||| | 4 |
| 3 | ||| | 3 |
| 4 | ||| | 3 |
| 5 | ||| | 3 |
| 6 | ||| | 3 |
| Total | 20 |
In simple words: This table counts how many times each number on the die (from 1 to 6) came up when the die was rolled.
Exam Tip: Be neat when writing down tallies, and make sure that the sum of the frequencies equals the number of times the die was thrown (20).
Question 4. Following data shows the weekly wages (in Rs.) of 10 workers in a factory.
3500, 4250, 4000, 4250, 4000, 3750, 4750, 4000, 4250 and 4000
(i) Prepare a frequency distribution table.
(ii) What is the range of wages (in Rs.)?
(iii) How many workers are getting the maximum wages?
Answer:
(i) The frequency table representing the weekly wages of the workers is shown below:
| Weekly Wages (in Rs.) | Tally Marks | Frequency |
|---|---|---|
| 3500 | | | 1 |
| 3750 | | | 1 |
| 4000 | |||| | 4 |
| 4250 | ||| | 3 |
| 4750 | | | 1 |
| Total | 10 |
(ii) Range of wages = Maximum wage \( - \) Minimum wage
Range = Rs. 4750 \( - \) Rs. 3500 = Rs. 1250
(iii) The highest wage is Rs. 4750. From the table, we can see that only 1 worker receives this maximum wage.
In simple words: The table lists wages and counts how many workers earn each amount. The wage range is the difference between the highest and lowest earnings, which is Rs. 1250.
Exam Tip: Do not forget to write units like "Rs." next to numerical answers where appropriate, as omitting units may lead to loss of marks.
Question 5. The marks obtained by 40 students of a class are given below :
80, 10, 30, 70, 60, 50, 50, 40, 40, 20, 40, 90, 50, 30, 70, 10, 60, 50, 20, 70, 70, 30, 80, 40, 20, 80, 90, 50, 80, 60, 70, 40, 50, 60, 90, 60, 40, 40, 60 and 60
(i) Construct a frequency distribution table.
(ii) Find how many students have marks equal to or more than 70?
(iii) How many students obtained marks below 40?
Answer:
(i) The frequency table of marks for the 40 students is as follows:
| Marks | Tally Marks | Frequency |
|---|---|---|
| 10 | || | 2 |
| 20 | ||| | 3 |
| 30 | ||| | 3 |
| 40 | 7 | |
| 50 | 6 | |
| 60 | 7 | |
| 70 | 5 | |
| 80 | |||| | 4 |
| 90 | ||| | 3 |
| Total | 40 |
(ii) Students with marks of 70 or higher are those who scored 70, 80, or 90:
Number of students = 5 + 4 + 3 = 12
(iii) Students with marks below 40 are those who scored 10, 20, or 30:
Number of students = 2 + 3 + 3 = 8 students
In simple words: The table groups the marks of students. 12 students scored 70 or more, and 8 students scored less than 40.
Exam Tip: Be precise when adding sub-categories. For "equal to or more than 70", remember to include the count for 70 itself along with 80 and 90.
Question 6. Arrange the following data in descending order:
3.3, 3.2, 3.1, 3.7, 3.6, 4.0, 3.5, 3.9, 3.8, 4.1, 3.5, 3.8, 3.7, 3.9 and 3.4.
(i) Determine the range.
(ii) How many numbers are less than 3.5?
(iii) How many numbers are 3.8 or above?
Answer:
First, let us sort the numbers from largest to smallest (descending order):
4.1, 4.0, 3.9, 3.9, 3.8, 3.8, 3.7, 3.7, 3.6, 3.5, 3.5, 3.4, 3.3, 3.2, 3.1
(i) Range is the difference between the largest value and the smallest value:
Range = \( 4.1 - 3.1 = 1.0 \) (or 1)
(ii) The numbers that are strictly smaller than 3.5 are:
3.4, 3.3, 3.2, 3.1
Total count = 4
(iii) The numbers that are 3.8 or larger are:
3.8, 3.8, 3.9, 3.9, 4.0, 4.1
Total count = 6
In simple words: After arranging the numbers from biggest to smallest, we find the range is 1.0. There are 4 values smaller than 3.5, and 6 values that are 3.8 or bigger.
Exam Tip: Be careful with the term "less than 3.5" - it does not include 3.5 itself, so we only count the numbers strictly smaller than 3.5.
Exercise 21(B)
Question 1. Find the mean of 53, 61, 60, 67 and 64.
Answer:
To find the mean, sum all the given values and then divide by the total count of numbers (n = 5):
\[ \text{Mean} = \frac{53 + 61 + 60 + 67 + 64}{5} \]
\[ \text{Mean} = \frac{305}{5} = 61 \]
In simple words: Add up all 5 numbers to get 305, and then divide this total by 5. The final mean is 61.
Exam Tip: Show your addition step and final division clearly so you can secure step-by-step marks even if you make a calculation error.
Question 2. Find the mean of first six natural numbers.
Answer:
The first six natural numbers are: 1, 2, 3, 4, 5, 6. Here, n = 6.
Let us calculate their mean:
\[ \text{Mean} = \frac{1 + 2 + 3 + 4 + 5 + 6}{6} \]
\[ \text{Mean} = \frac{21}{6} = 3.5 \]
In simple words: Natural numbers are counting numbers starting from 1. Add the first six together to get 21, and divide by 6 to get 3.5.
Exam Tip: Remember that natural numbers start from 1, whereas whole numbers start from 0. Confusing these is a common mistake.
Question 3. Find the mean of first ten odd natural numbers.
Answer:
The first ten odd natural numbers are: 1, 3, 5, 7, 9, 11, 13, 15, 17, 19. Here, n = 10.
Let us calculate their mean:
\[ \text{Mean} = \frac{1 + 3 + 5 + 7 + 9 + 11 + 13 + 15 + 17 + 19}{10} \]
\[ \text{Mean} = \frac{100}{10} = 10 \]
In simple words: List the first 10 odd numbers, which are numbers that cannot be divided by 2. Add them to get 100, then divide by 10. The mean is 10.
Exam Tip: A useful shortcut to remember is that the sum of the first n odd natural numbers is always \( n^2 \). For n = 10, the sum is \( 10^2 = 100 \), and the mean is \( 100/10 = 10 \).
Question 4. Find the mean of all factors of 10.
Answer:
The factors of 10 are the numbers that divide 10 completely without leaving any remainder: 1, 2, 5, 10. Here, n = 4.
Let us calculate their mean:
\[ \text{Mean} = \frac{1 + 2 + 5 + 10}{4} \]
\[ \text{Mean} = \frac{18}{4} = 4.5 \]
In simple words: The numbers that divide 10 are 1, 2, 5, and 10. Adding them gives 18, and dividing by 4 gives 4.5.
Exam Tip: Always include 1 and the number itself (10 in this case) when listing all factors of a number, as they are often missed.
Question 5. Find the mean of x + 3, x + 5, x + 7, x + 9 and x + 11.
Answer:
There are 5 given terms (n = 5). Let us sum them and divide by 5 to find the mean:
\[ \text{Mean} = \frac{(x + 3) + (x + 5) + (x + 7) + (x + 9) + (x + 11)}{5} \]
Combine the like terms in the numerator:
\[ \text{Mean} = \frac{5x + 35}{5} \]
Factor out 5 from the numerator:
\[ \text{Mean} = \frac{5(x + 7)}{5} = x + 7 \]
In simple words: Add the five expressions together to get 5x + 35. Divide each part by 5, which leaves you with x + 7.
Exam Tip: Be careful when combining terms. Add the variables (x) together first, and then add the numbers separately before simplifying.
Question 6. If different values of variable x are 19.8, 15.4, 13.7, 11.71, 11.8, 12.6, 12.8, 18.6, 20.5 and 21.1, find the mean.
Answer:
There are 10 values of variable x (n = 10). Let us calculate the mean by summing these values and dividing by 10:
\[ \text{Mean} = \frac{19.8 + 15.4 + 13.7 + 11.71 + 11.8 + 12.6 + 12.8 + 18.6 + 20.5 + 21.1}{10} \]
\[ \text{Mean} = \frac{158.01}{10} = 15.801 \]
In simple words: Add all 10 decimal numbers together to get 158.01. Divide this sum by 10 to get the mean, which is 15.801.
Exam Tip: Be very careful when aligning decimals for addition, especially with numbers like 11.71 which have two decimal places instead of one.
Question 7. The mean of a certain number of observations is 32. Find the resulting mean, if each observation is,
(i) increased by 3
(ii) decreased by 7
(iii) multiplied by 2
(iv) divided by 0.5
(v) increased by 60%
(vi) decreased by 20%
Answer:
If a mathematical operation is performed on every observation in a data set, the mean of the data set is affected in the exact same way:
(i) Since each observation is increased by 3, the mean is also increased by 3:
Resulting mean = \( 32 + 3 = 35 \)
(ii) Since each observation is decreased by 7, the mean is also decreased by 7:
Resulting mean = \( 32 - 7 = 25 \)
(iii) Since each observation is multiplied by 2, the mean is also multiplied by 2:
Resulting mean = \( 32 \times 2 = 64 \)
(iv) Since each observation is divided by 0.5, the mean is also divided by 0.5:
Resulting mean = \( \frac{32}{0.5} = 64 \)
(v) Since each observation is increased by 60%, the mean is also increased by 60%:
Resulting mean = \( 32 + (60\% \text{ of } 32) = 32 + 19.2 = 51.2 \)
(vi) Since each observation is decreased by 20%, the mean is also decreased by 20%:
Resulting mean = \( 32 - (20\% \text{ of } 32) = 32 - 6.4 = 25.6 \)
In simple words: Any change made to all the numbers in a list will change the mean in the same way. If you add, subtract, multiply, divide, or take a percentage, do the same to 32.
Exam Tip: Remember that increasing or decreasing by a percentage means you must calculate that percentage of the original mean (32) and then add or subtract it, rather than just adding/subtracting the raw percentage value.
Question 8. The pocket expenses (per day) of Anuj, during a certain week, from monday to Saturday were Rs. 85.40, Rs. 88.00, Rs. 86.50, Rs. 84.75, Rs. 82.60 and Rs. 87.25. Find the mean pocket expenses per day.
Answer:
Anuj's expenses are recorded for 6 days (Monday to Saturday, n = 6). Let us find the mean of these daily expenses:
\[ \text{Mean} = \frac{\text{Rs. } 85.40 + \text{Rs. } 88.00 + \text{Rs. } 86.50 + \text{Rs. } 84.75 + \text{Rs. } 82.60 + \text{Rs. } 87.25}{6} \]
\[ \text{Mean} = \frac{\text{Rs. } 514.50}{6} = \text{Rs. } 85.75 \]
In simple words: Add the pocket money spent each day from Monday to Saturday to get Rs. 514.50. Divide this total by 6 days to find that the average daily expense is Rs. 85.75.
Exam Tip: Be meticulous with decimal additions. Writing down zero placeholders (like Rs. 88.00 instead of Rs. 88) helps avoid column misalignment errors.
Question 9. If the mean of 8, 10, 7, x + 2 and 6 is 9, find the value of x.
Answer:
The given numbers are 8, 10, 7, x + 2, and 6. There are 5 observations (n = 5).
Since their mean is 9, we can write:
\[ \frac{8 + 10 + 7 + (x + 2) + 6}{5} = 9 \]
Simplify the numerator by adding the numbers:
\[ \frac{x + 33}{5} = 9 \]
Multiply both sides by 5:
\[ x + 33 = 45 \]
Subtract 33 from both sides:
\[ x = 45 - 33 \]
\[ x = 12 \]
In simple words: Since there are 5 items, their sum must be \( 9 \times 5 = 45 \). Adding the known numbers gives 33. Subtract 33 from 45 to get x = 12.
Exam Tip: Ensure you count "(x + 2)" as a single observation, not two separate ones, meaning the total count of observations in this set is 5.
Question 10. Find the mean of first six multiples of 3.
Answer:
The first six multiples of 3 are: 3, 6, 9, 12, 15, 18. Here, n = 6.
Let us calculate their mean:
\[ \text{Mean} = \frac{3 + 6 + 9 + 12 + 15 + 18}{6} \]
\[ \text{Mean} = \frac{63}{6} = 10.5 \]
In simple words: The first six multiples of 3 are the answers when you multiply 3 by 1, 2, 3, 4, 5, and 6. Add them to get 63, and divide by 6 to get 10.5.
Exam Tip: Writing down the list of multiples first ensures you do not miss a term or accidentally write a wrong multiple.
Question 11. Find the mean of first five prime numbers.
Answer:
The first five prime numbers are: 2, 3, 5, 7, 11. Here, n = 5.
Let us calculate their mean:
\[ \text{Mean} = \frac{2 + 3 + 5 + 7 + 11}{5} \]
\[ \text{Mean} = \frac{28}{5} = 5.6 \]
In simple words: Prime numbers are numbers greater than 1 that only have factors of 1 and themselves. The first five are 2, 3, 5, 7, and 11. Their sum is 28, and dividing by 5 gives 5.6.
Exam Tip: Remember that 1 is not a prime number, and 2 is the only even prime number. Do not include 1 or 9 in your list of prime numbers.
Question 12. The mean of six numbers : x - 5, x - 1, x, x + 2, x + 4 and x + 12 is 15. Find the mean of first four numbers.
Answer:
We are given six numbers with a mean of 15. Let us write the formula for their mean:
\[ \frac{(x - 5) + (x - 1) + x + (x + 2) + (x + 4) + (x + 12)}{6} = 15 \]
Simplify the numerator by combining like terms:
\[ \frac{6x + 12}{6} = 15 \]
\[ 6x + 12 = 90 \]
\[ 6x = 78 \]
\[ x = 13 \]
Now, let us find the values of all six numbers by substituting x = 13:
First number = \( 13 - 5 = 8 \)
Second number = \( 13 - 1 = 12 \)
Third number = \( 13 \)
Fourth number = \( 13 + 2 = 15 \)
Fifth number = \( 13 + 4 = 17 \)
Sixth number = \( 13 + 12 = 25 \)
Now, let us find the mean of the first four numbers (8, 12, 13, and 15):
\[ \text{Mean of first four numbers} = \frac{8 + 12 + 13 + 15}{4} \]
\[ \text{Mean of first four numbers} = \frac{48}{4} = 12 \]
In simple words: First, use the mean of all six numbers to solve for x, which is 13. Use this to find that the first four numbers are 8, 12, 13, and 15. Their average is 12.
Exam Tip: Be methodical. Finding the value of x is only the first step; you must substitute it back to find the actual numbers before calculating the second mean.
Question 13. Find the mean of squares of first five whole numbers.
Answer:
The first five whole numbers are: 0, 1, 2, 3, 4. Here, n = 5.
The squares of these numbers are:
\( 0^2 = 0 \)
\( 1^2 = 1 \)
\( 2^2 = 4 \)
\( 3^2 = 9 \)
\( 4^2 = 16 \)
Let us calculate the mean of these squares:
\[ \text{Mean} = \frac{0 + 1 + 4 + 9 + 16}{5} \]
\[ \text{Mean} = \frac{30}{5} = 6 \]
In simple words: Whole numbers start from 0. Square each of the first five whole numbers to get 0, 1, 4, 9, and 16. Their average is 6.
Exam Tip: Remember that whole numbers start with 0, not 1. If you start with 1, you will use incorrect values and get the wrong answer.
Question 14. If the mean of 6, 4, 7, p and 10 is 8, find the value of p.
Answer:
There are 5 observations in total (n = 5). Since their mean is 8, we can write:
\[ \frac{6 + 4 + 7 + p + 10}{5} = 8 \]
Combine the known values in the numerator:
\[ \frac{27 + p}{5} = 8 \]
Multiply both sides by 5:
\[ 27 + p = 40 \]
Subtract 27 from both sides:
\[ p = 40 - 27 \]
\[ p = 13 \]
In simple words: The sum of the 5 numbers must be \( 8 \times 5 = 40 \). The sum of the four known numbers is 27. Subtract 27 from 40 to find p = 13.
Exam Tip: Always verify your value of p by substituting it back into the average formula to check if the mean is indeed 8.
Question 15. Find the mean of first six multiples of 5.
Answer:
The first six multiples of 5 are: 5, 10, 15, 20, 25, 30. Here, n = 6.
Let us calculate their mean:
\[ \text{Mean} = \frac{5 + 10 + 15 + 20 + 25 + 30}{6} \]
\[ \text{Mean} = \frac{105}{6} = 17.5 \]
In simple words: The first six multiples of 5 are 5, 10, 15, 20, 25, and 30. Adding them up gives 105, and dividing by 6 gives 17.5.
Exam Tip: Make sure you list exactly six multiples and divide by 6, not 5, to find the mean.
Question 16. The rainfall (in mm) in a city on 7 days of a certain week is recorded as follows:
Day : Mon, Tue, Wed, Thus, Fri, Sat, Sun
Rainfall (in mm) : 0.5, 2.7, 2.6, 0.5, 2, 5.8, 1.5
Find the total and average (mean) rainfall for the week.
Answer:
We can calculate the required rainfall statistics as follows:
Total rainfall = Sum of rainfall on all 7 days
Total rainfall = 0.5 + 2.7 + 2.6 + 0.5 + 2.0 + 5.8 + 1.5 = 15.6 mm
Average (mean) rainfall = Total rainfall / Number of days
Average rainfall = \( \frac{15.6}{7} \approx 2.23 \) mm (or 2.2 mm)
In simple words: Add the rainfall for all 7 days to get a total of 15.6 mm. Divide this total by 7 days to get an average daily rainfall of 2.2 mm.
Exam Tip: Read the table carefully and don't forget the decimal point when adding. Write "mm" at the end of both answers.
Question 17. The mean of marks scored by 100 students was found to be 40, later on it was discovered that a score of 53 was misread as 83. Find the correct mean.
Answer:
We can find the correct mean by adjusting the sum of observations as follows:
Total number of students (observations) = 100
Incorrect mean of 100 observations = 40
Incorrect sum of marks = \( 100 \times 40 = 4000 \)
Now, let us correct the sum by subtracting the misread score (83) and adding the correct score (53):
Correct sum of marks = 4000 \( - \) 83 + 53 = 3970
Now, calculate the correct mean:
Correct mean = \( \frac{3970}{100} = 39.7 \)
In simple words: The original total sum was 4000. Since 53 was misread as 83, the total was 30 marks too high. Subtract 30 to get the correct sum of 3970, then divide by 100 to get the new mean, 39.7.
Exam Tip: Remember this quick formula: Correct Sum = Incorrect Sum \( - \) Incorrect Value + Correct Value. It is a reliable way to avoid mistakes on this question type.
Question 18. The mean of five numbers is 27. If one number is excluded, the mean of remaining numbers is 25. Find the excluded number.
Answer:
We can find the excluded number by comparing the sums before and after the number is removed:
Mean of 5 numbers = 27
Sum of these 5 numbers = \( 27 \times 5 = 135 \)
When 1 number is excluded, 4 numbers remain:
Mean of these 4 remaining numbers = 25
Sum of these 4 remaining numbers = \( 25 \times 4 = 100 \)
Therefore, the excluded number is the difference between the two sums:
Excluded number = 135 \( - \) 100 = 35
In simple words: The sum of all 5 numbers is 135. When one is taken away, the sum of the remaining 4 numbers is 100. The missing number is 135 minus 100, which is 35.
Exam Tip: Always double check that when one number is excluded from five, you divide or multiply by 4 (the remaining count), not 5.
Question 19. The mean of 5 numbers is 27. If one new number is included, the new mean is 25. Find the included number.
Answer:
We can find the included number by comparing the sums before and after the new number is added:
Mean of 5 numbers = 27
Sum of these 5 numbers = \( 27 \times 5 = 135 \)
When 1 new number is included, we have 6 numbers in total:
New mean of 6 numbers = 25
Sum of these 6 numbers = \( 25 \times 6 = 150 \)
Therefore, the included number is the difference between the new sum and the old sum:
Included number = 150 \( - \) 135 = 15
In simple words: The sum of the original 5 numbers is 135. When a 6th number is added, the total sum becomes 150. The value of this new number is 150 minus 135, which is 15.
Exam Tip: Be sure to increase the total count of numbers to 6 when calculating the new sum after an extra number is included.
Question 20. Mean of 5 numbers is 20 and mean of other 5 numbers is 30. Find the mean of all the 10 numbers taken together.
Answer:
To find the combined mean of all 10 numbers, we need to calculate the sum of all 10 numbers:
Sum of the first 5 numbers = \( 5 \times 20 = 100 \)
Sum of the other 5 numbers = \( 5 \times 30 = 150 \)
Total sum of all 10 numbers = \( 100 + 150 = 250 \)
Now, divide the total sum by the total count of numbers (10):
Combined mean = \( \frac{250}{10} = 25 \)
In simple words: The first 5 numbers add up to 100, and the next 5 numbers add up to 150. Together, all 10 numbers add up to 250. Dividing by 10 gives a combined average of 25.
Exam Tip: Do not simply average the two means unless both groups have the exact same number of items. Here, since both groups have 5 numbers, averaging them directly works, but using the total sum method is safer and always correct.
Question 21. Find the median of:
(i) 5, 7, 9, 11, 15, 17, 2, 23 and 19
(ii) 9, 3, 20, 13, 0, 7 and 10
(iii) 18, 19, 20, 23, 22, 20, 17, 19, 25 and 21
(iv) 3.6, 9.4, 3.8, 5.6, 6.5, 8.9, 2.7, 10.8, 15.6, 1.9 and 7.6.
Answer:
To find the median, first arrange the terms in ascending order:
(i) Ascending order: 2, 5, 7, 9, 11, 15, 17, 19, 23
Number of terms (n) = 9 (which is odd).
\[ \text{Median} = \left(\frac{n+1}{2}\right)\text{-th term} \]
\[ \text{Median} = \left(\frac{9+1}{2}\right)\text{-th term} = \text{5th term} = 11 \]
(ii) Ascending order: 0, 3, 7, 9, 10, 13, 20
Number of terms (n) = 7 (which is odd).
\[ \text{Median} = \left(\frac{7+1}{2}\right)\text{-th term} = \text{4th term} = 9 \]
(iii) Ascending order: 17, 18, 19, 19, 20, 20, 21, 22, 23, 25
Number of terms (n) = 10 (which is even).
\[ \text{Median} = \frac{1}{2} \times \left[ \left(\frac{10}{2}\right)\text{-th term} + \left(\frac{10}{2} + 1\right)\text{-th term} \right] \]
\[ \text{Median} = \frac{1}{2} \times [ \text{5th term} + \text{6th term} ] \]
\[ \text{Median} = \frac{1}{2} \times [ 20 + 20 ] = 20 \]
(iv) Ascending order: 1.9, 2.7, 3.6, 3.8, 5.6, 6.5, 7.6, 8.9, 9.4, 10.8, 15.6
Number of terms (n) = 11 (which is odd).
\[ \text{Median} = \left(\frac{11+1}{2}\right)\text{-th term} = \text{6th term} = 6.5 \]
In simple words: To find the median, sort the numbers from smallest to largest first. If the count of numbers is odd, the median is the exact middle number. If the count is even, average the two middle numbers.
Exam Tip: Never calculate the median without sorting the numbers first; doing so on unsorted data is a very common mistake.
Question 22. Find the mean and the mode for the following data :
| Term | 18 | 22 | 26 | 30 | 34 | 38 |
|---|---|---|---|---|---|---|
| Frequency | 3 | 5 | 10 | 2 | 8 | 2 |
Answer:
Let us prepare the calculation table for finding the mean:
| Term (\(x_i\)) | Frequency (\(f_i\)) | \(f_i \times x_i\) |
|---|---|---|
| 18 | 3 | 54 |
| 22 | 5 | 110 |
| 26 | 10 | 260 |
| 30 | 2 | 60 |
| 34 | 8 | 272 |
| 38 | 2 | 76 |
| Total | 30 | 832 |
Now, let us calculate the mean:
\[ \text{Mean} = \frac{\sum f_i x_i}{\sum f_i} = \frac{832}{30} \approx 27.73 \]
To find the mode, look for the term with the highest frequency:
Since the term 26 has the highest frequency of 10, the mode is 26.
In simple words: To find the mean, multiply each term by its frequency, add them up to get 832, and divide by the total frequency of 30. The mode is 26 because it occurs most often (10 times).
Exam Tip: Be sure not to mix up the terms and frequencies when finding the mode. The mode is the term itself (26), not its frequency (10).
Question 23. Find the mode of:
(i) 5, 6, 9, 13, 6, 5, 6, 7, 6, 6, 3
(ii) 7, 7, 8, 10, 10, 11, 10, 13, 14
Answer:
The mode is the value that appears most frequently in the data set:
(i) Arranging the data in ascending order:
3, 5, 5, 6, 6, 6, 6, 6, 7, 9, 13
Here, the number 6 appears 5 times, which is more than any other number.
Mode = 6
(ii) Arranging the data in ascending order:
7, 7, 8, 10, 10, 10, 11, 13, 14
Here, the number 10 appears 3 times, which is more than any other number.
Mode = 10
In simple words: Look for the number that shows up the most times in each list. In the first list, it is 6, and in the second list, it is 10.
Exam Tip: Listing the numbers in order helps you group identical values together, making it very easy to count which one appears the most.
Question 24. Find the mode of :
(i)
| \(x\) | 15 | 16 | 17 | 18 | 19 | 20 | 21 | 22 | 23 |
|---|---|---|---|---|---|---|---|---|---|
| \(f\) | 6 | 7 | 9 | 13 | 10 | 12 | 8 | 0 | 4 |
(ii)
| Height (cm) | 37 | 38 | 39 | 40 | 41 |
|---|---|---|---|---|---|
| Number of plants | 46 | 89 | 93 | 90 | 153 |
Answer:
(i) In the first table, the maximum frequency is 13, which corresponds to the variable value of 18.
Mode = 18
(ii) In the second table, the maximum frequency is 153, which corresponds to the height of 41 cm.
Mode = 41 cm
In simple words: Find the column with the largest frequency number in the table. The term directly above it is the mode. For the first table, it is 18, and for the second table, it is 41 cm.
Exam Tip: Remember to always state the units (such as "cm") for the mode if the original data includes units.
Question 25. The heights (in cm) of 8 girls of a class are 140, 142, 135, 133, 137, 150, 148 and 138 respectively. Find the mean height of these girls and their median height.
Answer:
There are 8 girls (n = 8). Let us find the mean height and median height:
(i) Calculation of Mean Height:
\[ \text{Mean} = \frac{140 + 142 + 135 + 133 + 137 + 150 + 148 + 138}{8} \]
\[ \text{Mean} = \frac{1123}{8} = 140.375\text{ cm} \]
(ii) Calculation of Median Height:
First, arrange the heights in ascending order:
133, 135, 137, 138, 140, 142, 148, 150
Since n = 8 (which is even), the median is the average of the two middle terms:
\[ \text{Median} = \frac{1}{2} \times [ \text{4th term} + \text{5th term} ] \]
\[ \text{Median} = \frac{138 + 140}{2} = \frac{278}{2} = 139\text{ cm} \]
In simple words: The mean height is found by adding all heights and dividing by 8, giving 140.375 cm. The median height is 139 cm, which is the average of the two middle values (138 and 140).
Exam Tip: When the number of terms is even, remember to calculate the average of the two middle numbers to find the correct median.
Question 26. Find the mean, the median and the mode of:
(i) 12, 24, 24, 12, 30 and 12
(ii) 21, 24, 21, 6, 15, 18, 21, 45, 9, 6, 27 and 15.
Answer:
We can calculate the mean, median, and mode for each set as follows:
(i) For the data set: 12, 24, 24, 12, 30, and 12 (n = 6)
- Mean:
\[ \text{Mean} = \frac{12 + 24 + 24 + 12 + 30 + 12}{6} = \frac{114}{6} = 19 \]
- Mode: The number 12 appears 3 times, which is the most frequent.
Mode = 12
- Median: Arrange in ascending order: 12, 12, 12, 24, 24, 30. The two middle terms are the 3rd and 4th terms:
\[ \text{Median} = \frac{12 + 24}{2} = \frac{36}{2} = 18 \]
(ii) For the data set: 21, 24, 21, 6, 15, 18, 21, 45, 9, 6, 27, and 15 (n = 12)
- Mean:
\[ \text{Mean} = \frac{21 + 24 + 21 + 6 + 15 + 18 + 21 + 45 + 9 + 6 + 27 + 15}{12} = \frac{228}{12} = 19 \]
- Mode: The number 21 appears 3 times, which is the most frequent.
Mode = 21
- Median: Arrange in ascending order: 6, 6, 9, 15, 15, 18, 21, 21, 21, 24, 27, 45. The two middle terms are the 6th and 7th terms:
\[ \text{Median} = \frac{18 + 21}{2} = \frac{39}{2} = 19.5 \]
In simple words: For both sets, find the average (mean), the middle number when sorted (median), and the most repeated number (mode).
Exam Tip: When checking your list to find the mode and median, it is helpful to cross off each number as you write it down to make sure you do not miss any terms.
Question 27. The following table shows the market positions of some brands of soap. Draw a suitable bar graph :
| Soap (brands) | A | B | C | D | E |
|---|---|---|---|---|---|
| No. of buyers | 51 | 27 | 15 | 24 | 18 |
Answer:
The market positions of the soap brands can be represented visually using the following bar graph:
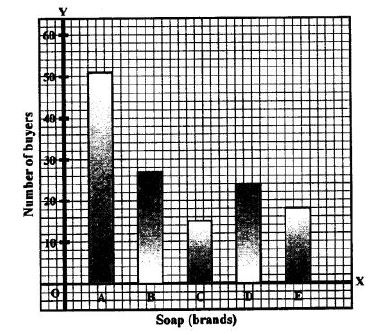
In simple words: This bar graph shows the number of buyers for each brand of soap. The taller the bar, the more buyers that brand has.
Exam Tip: Always make sure to choose an appropriate scale on the y-axis (such as 1 unit = 10 buyers) and label both axes clearly in your graph.
Question 28. The birth rate per thousand of different countries over a particular period of time is shown below.
| Country | INDIA | U.K. | CHINA | GERMANY | SWEDEN |
|---|---|---|---|---|---|
| Birth rate per thousand | 35 | 22 | 42 | 13 | 8 |
Answer:
The birth rates per thousand for the different countries can be represented in the following bar graph:
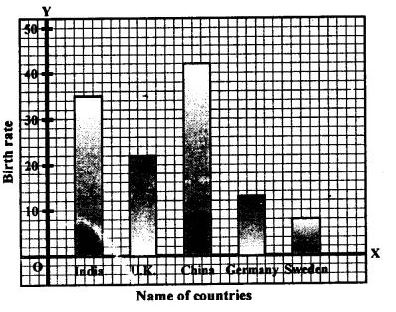
In simple words: This bar graph compares birth rates for five countries. China has the highest birth rate (42), and Sweden has the lowest (8).
Exam Tip: When plotting, maintain equal spacing between the bars and ensure all bars are of equal width for accurate visual presentation.
Free study material for Mathematics
ICSE Selina Concise Solutions Class 7 Mathematics Chapter 21 Data Handling
Students can now access the detailed Selina Concise Solutions for Chapter 21 Data Handling on our portal. These solutions have been carefully prepared as per latest ICSE Class 7 syllabus. Each solution given above has been updated based on the current year pattern to ensure Class 7 students have the most updated Mathematics content.
Master Selina Concise Textbook Questions
Our subject experts have provided detailed explanations for all the questions found in the Selina Concise textbook for Class 7 Mathematics. We have focussed on making the concepts easy for you in Chapter 21 Data Handling so that students can understand the concepts behind every answer. For all numerical problems and theoretical concepts these solutions will help in strengthening your analytical skill required for the ICSE examinations.
Complete Mathematics Exam Preparation
By using these Selina Concise Class 7 solutions, you can enhance your learning and identify areas that need more attention. We recommend solving the Mathematics Questions from the textbook first and then use our teacher-verified answers. For a proper revision of Chapter 21 Data Handling, students should also also check our Revision Notes and Sample Papers available on studiestoday.com.
FAQs
You can download the verified Selina Concise solutions for Chapter 21 Data Handling on StudiesToday.com. Our teachers have prepared answers for Class 7 Mathematics as per 2026-27 ICSE academic session.
Yes, our solutions for Chapter 21 Data Handling are designed as per new 2026 ICSE standards. 40% competency-based questions required for Class 7, are included to help students understand application-based logic behind every Mathematics answer.
Yes, every exercise in Chapter 21 Data Handling from the Selina Concise textbook has been solved step-by-step. Class 7 students will learn Mathematics conceots before their ICSE exams.
Yes, follow structured format of these Selina Concise solutions for Chapter 21 Data Handling to get full 20% internal assessment marks and use Class 7 Mathematics projects and viva preparation as per ICSE 2026 guidelines.